Review

The Role of Earth Observation in an Integrated Deprived Area Mapping “System” for Low-to-Middle Income Countries

1
Faculty of Geo-Information Science and Earth Observation (ITC), University of Twente, 7514 AE Enschede, The Netherlands
2
Department of Social Statistics and Department of Geography, University of Southampton, Highfield Campus, Building 58, Southampton SO17 1BJ, UK
3
WorldPop Research Group, School of Geography and Environmental Science, University of Southampton, Southampton SO17 1BJ, UK
4
Department of Computational and Data Sciences, George Mason University, 4400 University Drive, Fairfax, VA 22030, USA
5
Department of Geosciences, Environment and Society, Université libre de Bruxelles (ULB), 1050 Bruxelles, Belgium
6
Department of Geography, George Washington University, Washington, DC 20052, USA
7
Global Urban Observatory, UN-Habitat, 30030-00100 Nairobi, Kenya
8
Slum Dwellers International, 20509-00100 Nairobi, Kenya
9
Institute for Global Sustainable Development, University of Warwick, Coventry CV4 7AL UK
10
The Alan Turing Institute, British Library, London NW1 2DB, UK
11
African Population & Health Research Center, 10787-00100 Nairobi, Kenya
*
Author to whom correspondence should be addressed.
Remote Sens. 2020, 12(6), 982; https://doi.org/10.3390/rs12060982
Submission received: 18 February 2020 / Revised: 10 March 2020 / Accepted: 11 March 2020 / Published: 18 March 2020

Abstract

:
Urbanization in the global South has been accompanied by the proliferation of vast informal and marginalized urban areas that lack access to essential services and infrastructure. UN-Habitat estimates that close to a billion people currently live in these deprived and informal urban settlements, generally grouped under the term of urban slums. Two major knowledge gaps undermine the efforts to monitor progress towards the corresponding sustainable development goal (i.e., SDG 11—Sustainable Cities and Communities). First, the data available for cities worldwide is patchy and insufficient to differentiate between the diversity of urban areas with respect to their access to essential services and their specific infrastructure needs. Second, existing approaches used to map deprived areas (i.e., aggregated household data, Earth observation (EO), and community-driven data collection) are mostly siloed, and, individually, they often lack transferability and scalability and fail to include the opinions of different interest groups. In particular, EO-based-deprived area mapping approaches are mostly top-down, with very little attention given to ground information and interaction with urban communities and stakeholders. Existing top-down methods should be complemented with bottom-up approaches to produce routinely updated, accurate, and timely deprived area maps. In this review, we first assess the strengths and limitations of existing deprived area mapping methods. We then propose an Integrated Deprived Area Mapping System (IDeAMapS) framework that leverages the strengths of EO- and community-based approaches. The proposed framework offers a way forward to map deprived areas globally, routinely, and with maximum accuracy to support SDG 11 monitoring and the needs of different interest groups.

Graphical Abstract

1. Introduction

Most low- and middle-income countries (LMICs) are undergoing rapid urban transitions, or will be soon, and are facing an unprecedented growth of large deprived areas, commonly seen as areas of poor housing and environmental quality and lacking basic services and infrastructure [1]. Megacities with an already high percentage of the population living in such neighborhoods, such as Kinshasa (the Democratic Republic of the Congo), Delhi (India), and Dhaka (Bangladesh), are all expected to grow upwards of 700,000 people per year until 2030 [2]. By 2050, an estimated 2.5 billion people will be added to the planet, with 90% of this population growth concentrated in Asian and African cities [3]. Many of these cities already have limited capacity to deal with current urbanization problems, leading to the continued persistence and growth of slum-like neighborhoods, increasing socioeconomic disparities and the marginalization of unprecedented numbers of people [3]. To understand the level of marginalization as it relates to the urban poorest in LMICs (e.g., in terms of health, natural hazards, and climate change risks), spatial and contextual information about such areas is essential. This requires a conceptualization of what are slum-like neighborhoods and data on their locations, spatial extents, demographics, and socioeconomic characteristics to allow for their adequate monitoring over time.
These areas, together with informal urban settlements, are often grouped under the term of "slum areas". However, no global area-based definition currently exists, nor does any global database contain the aforementioned data on such areas. A number of efforts have been made to define “slum areas”, including expert meetings in 2002 [4], 2008 [5], and 2017 [6] focusing on frameworks [7,8] and operational definitions [9,10,11,12]. The lack of a clear definition of the term "slum area" is due, in large part, to the enormous diversity and dynamics of urban areas and the fact that perceptions of such areas are usually context-dependent [13]. UN-Habitat provides a widely accepted definition of the term "slum household". A household or group of individuals is classified as a slum household if they lack any of the following: (1) durable housing, (2) sufficient living space, (3) safe water, (4) adequate sanitation, or (5) security of tenure [14].
The slum household definition has been used to classify small areas (e.g., census enumeration areas or survey clusters) as “slum areas” once the number of slum households in an area reaches a specified threshold (e.g., 50%—discussed further in Section 2) [15,16,17,18]. Although straightforward to operationalize, a household-level slum area definition fails to account for some of the most critical area-level risks and outcomes that result from living in deprived areas [8]. This definition has also been shown to overestimate the extent of deprived areas. For instance, urban areas that have been classified as “deprived” (aggregate of slum households to areas) are not considered as such by local communities and stakeholders [19]. Furthermore, this approach has previously been shown to classify entire cities as deprived (e.g., Addis Ababa [20,21]).
The concept of deprived areas reflects multiple social, environmental, and ecological factors that affect health and wellbeing above and beyond the household level. For example, living in deprived areas can increase the incidence of diseases via exposure to animal vectors [22] and crowding of buildings, injuries caused by hazards such as fire, vulnerability to extreme weather events, higher incidence of crime, and physical and social barriers to services [23]. In addition, members of both slum and non-slum households located within the same deprived area face multiple area-level risks, such as seasonal flooding;, lack of green space; environmental pollution (e.g., air, noise and land pollution from open sewers and trash piles); and crime [24]. For this reason, a deprived area faces multiple combined social and physical risks, which can also differ across cities and countries and even within them [7].
The chronic lack of deprived area maps in LMICs [25] has several implications. For instance, half of the 232 indicators used to monitor the 17 sustainable development goals (SDGs) are derived from census or survey data, and nearly a quarter require population figures to be disaggregated by socioeconomic groups and geographic areas [26]. However, not all countries have a recent census, e.g., between 2008 and 2017, around 11% of countries did not conduct one [27]. For example, SDG 11 [28], to “make cities and human settlements inclusive, safe, resilient and sustainable” is measured, in part, by identifying the “proportion of the urban population living in slums, informal settlements or inadequate housing” (SDG 11.1.1) [29]. Only a handful of national statistical agencies in LMICs have access to maps that allow identifying the most deprived urban communities using census data at fine spatial scales. Furthermore, in countries where these maps exist, their spatial coverage is usually limited to only major cities and are typically only available for one temporal snapshot (e.g., [30,31]).
The lack of deprived area maps creates a circular problem. With no spatial data on such areas, survey samples and field data collection are more likely to underreport deprived communities in both national censuses and household surveys. However, if deprived area maps exist, deprivation indicators are generally diluted in urban averages when using administrative boundaries [32,33,34]. In Nairobi, for example, approximately 60% of the population currently live in deprived areas, which accounts for only about 4% of the built-up area for that city [35]. As a consequence, taking a random sample of survey locations to collect field data for this city might implicitly exclude most of these areas [35]. In addition, maps of deprived areas are required for numerous other applications. For instance, disaggregating existing census and survey data [30], planning and implementing more accurate surveys and censuses [3], effectively allocating public services [36], planning and evaluating health policies and campaigns [37,38,39], responding to humanitarian disasters [40,41], and making long-term development decisions [42,43,44]. However, current data on the SDG indicator 11.1.1 is based on national estimates that contain large data gaps, high uncertainties, and very limited spatial information [40].
Many approaches have been used to map deprived areas over the last few decades. These can generally be grouped into four distinct mapping approaches: (1) aggregation of census data and survey of “slum households” to small areas (e.g., [45]); (2) field-based mapping (e.g., [46,47]); (3) manual delineation of imagery (e.g., [36,48,49]; and (4) more recent imagery classification, including machine learning (e.g., [50,51,52]). These approaches have largely remained siloed and all approaches, considered separately, pose major shortcomings. However, as the use of geospatial data and earth observation (EO) methods are adopted in new disciplines, computing power increases, and global initiatives, such as the SDGs, are established, siloed approaches have no apparent reason to persist.
While the body of EO literature about deprived area mapping is rapidly increasing (e.g., [50,51,53,54,55,56,57,58,59,60,61,62,63,64,65]), several challenges in this area still exist. For example, most studies are not addressing global information needs (e.g., producing data in support of SDG 11 [66]), with most deprived area mapping approaches mainly focusing on small areas below the city scale and for very specific sites. Further, very few approaches have been used to examine the temporal dynamics of slums to understand how conditions between and among them change over time (e.g., due to changes with policy [7]). This has led to very specific approaches towards studying and understanding deprived areas [12], which may limit our ability to understand and address their specific issues at the different spatial (i.e., location, national, and global) and temporal scales. These and other gaps in the literature about deprived area mapping approaches can be summarized as lacking: (1) scalability (i.e., researchers work on small areas of several km2 not at city or urban regional scales), (2) transferability (e.g., methods are tailored to one local context, but their transferability to other cities and generalization potential are not tested), (3) understanding of the local context (e.g., complex machine learning and artificial intelligence (AI) models are trained without local data; i.e., training and validation data are generated by visual imagery interpretation without ground data or field knowledge), (4) inclusion of socioeconomic characteristics of deprivation (i.e., focus solely on physical characteristics of deprived areas), and (5) clear validation protocols (e.g., accuracy assessment results are not necessarily comparable between studies as different measurements are used). From the large body of literature on EO-based methods, e.g., ranging from pixel- (e.g., [51]), grid- (e.g., [50]), segment-based (e.g., [56,67]), employing rule-based (e.g., [37,68]), classical machine learning (e.g., [69]), or deep-learning methods (e.g., [70]), it is difficult to conclude which methods are most promising to address the five aforementioned methodological gaps towards achieving a large-scale and long-term deprived area mapping framework (further discussed in Section 3).
The authors of this review are part of a growing community of experts representing the aforementioned deprived area mapping approaches. A joint effort recently summarized existing slum area mapping approaches and proposed an integrated system that leverages the strengths of each approach [71]. The backbone of the proposed system tackles the integration of diverse data sources via statistical models and EO data. In this paper, we build upon previous systematic reviews [10,12] and expert meetings [4,5,6] to assess the role of EO approaches to slum area mapping and the requirement to link these methods to other silos and produce slum area maps globally, routinely, and with maximum accuracy across LMICs.

2. The Design of an Integrated Deprived Area Mapping System (IDeAMapS)

Within the last decade, there has been immense growth in the number of studies that use machine learning-based methods to map deprived areas. These studies show the potential of classical machine learning algorithms (e.g., decision trees) to map slum areas at the city level with high mapping accuracy [72]. More recent approaches also apply deep-learning techniques—in particular, convolutional neural networks (CNNs)—to map deprived areas with even higher accuracy [56]. However, many EO studies work on relatively small areas of few km2 [73], which do not allow for assessing the potential of EO data for city-scale mapping. Therefore, we discuss in this section, the basic requirements for a deprived area mapping system and compare current mapping approaches.

2.1. Requirements for Deprived Area Mapping

Table 1 shows the requirements for the development of IDeAMapS, supported by EO-data and methods (discussed in the next section). Seven requirements have been identified in this table based on an in-depth literature review of deprived area mapping needs. The identified requirements cover a broad spectrum of spatial, temporal, physical, and social needs for informing more comprehensive mapping practices of deprived areas.
The following briefly explains each of the seven requirements for IDeAMapS (Table 1) in greater detail:
  • Relating to area physical characteristics: Deprived areas are characterized by their morphology in the urban environment. Physical indicators of such areas reflect building characteristics such as their size, shape, and height; road and other access networks; building density; settlement shape; settlement location with respect to environmental features such as public green or blue spaces, steep slopes, and flood zones; and neighborhood characteristics such as proximity to railways and high-voltage power lines [9].
  • Relating to area social characteristics: Deprived areas are characterized by a wide range of features in their social environment, which are influenced by policies, regulations, and practices (such as tenure or waste management). Social indicators of deprived areas include the presence of crime; proximity and accessibility to schools, health facilities, shops, jobs, and public infrastructure; and social capital derived from community-based organizations and among neighbors with shared identities [8].
  • Context-dependent: The physical and social characteristics of deprived areas differ across cities and countries and even within one neighborhood [10]. Furthermore, such areas are not static. The characteristics that define deprived areas at particular moments in time may alter due to changes in local, national, and global factors [5,12].
  • Comparable across cities and countries: To adequately support national planning activities and programs, and to be used in global initiatives such as the SDGs, there must be consistency in deprived area definitions across cities and countries [23]. This is meant to set the basic requirements for data on deprived areas.
  • Updated frequently with timely data: Deprived areas are highly dynamic and can change fast [75]. Common transition processes relate to development stages, i.e., from low-density infant settlements to high-density saturated neighborhoods, sudden major shifts in population due to demolitions or rapid growth, locational dynamics of temporary settlements, or deprived areas transformed into nondeprived after successful upgrading. Therefore, frequent updates to deprived area maps are necessary [76].
  • Protective of individual privacy and vulnerable populations: Given the relatively high spatio-temporal resolution of deprived area maps, individual and group privacy in all published data, as well as transparency in the methods used, should be ensured. There may also be a need to selectively mask the most vulnerable deprived areas or blur their boundaries [74].
  • Developed in an inclusive multi-stakeholder process: The existence of deprived areas reflects a story of social inequality, exclusion, and/or oppression. Urban deprivation does not emerge at random, and their transition into a place that is “inclusive, safe, resilient, and sustainable” requires addressing the policies and social attitudes that caused its establishment. This requires the involvement of communities and authorities, both locally and nationally [77].

2.2. Current Approaches to Deprived Area Mapping

Existing efforts to map deprived areas follow one or a combination of the four general approaches discussed in Section 1. These approaches have operated in parallel over the last two decades, largely in silos, and each with its own strengths and limitations. In Table 2, we summarize the strengths of each approach and, in the subsections that follow, discuss them briefly and show that none of the existing approaches, considered separately, meet all requirements for deprived area maps.

2.2.1. Aggregated Slum Households Approach

The aggregated slum household approach uses the UN-Habitat slum household definition along with small areal units such as census enumeration areas or survey clusters [78]. In this approach, an areal unit is classified as deprived when 50% (or some other threshold) of the households are classified as slum households. It is popular among demographers and others familiar with census and survey data. Key strengths of this approach are that it is compatible with the existing UN-Habitat slum household definition, and area boundaries are flexible. However, this approach has two significant limitations. First, slum-household indicators do not reflect the social, environmental, and ecological factors of deprived areas. Second, this approach could exclude small deprived areas within a larger nondeprived areas [79] or small remote settlements [70]. In general, the size of deprived areas can be rather small [70]. For instance, a recent comparison of the size of deprived areas across several cities in Asia, Africa, and Latin America concluded that the average extent of such areas is around 1.6 hectares [80]. Furthermore, this slum-household data aggregation approach can involve the ubiquitous “modifiable areal unit problem (MAUP)” [81]. This issue manifests itself when an area is arbitrarily divided across two or more areal units, resulting in a small portion of the deprived area in each unit and no units being classified as deprived. In spite of potential MAUP-related issues, there is a general agreement that aggregated household indicators could serve as a proxy for the social characteristics of deprived areas (e.g., neighborhood poverty and access to social protection programs) [82]. However, this proxy would poorly reflect other aspects, such as limited services and the strength of social networks. Finally, the aggregation of household data is dependent on the frequency of censuses’ and surveys’ data collection, which typically occur, at most, once every 10 years. However, after completion, the publication of census and survey data usually takes one to two years, preventing deprived area maps from being updated frequently [12]. At this point, there may also have been substantial physical and social changes to the deprived area, thus making the use of such data unreliable. Furthermore, in some LMICs, censuses and surveys are sporadic; for instance, in the Democratic Republic of the Congo, the last national census was carried out over thirty years ago, in 1984 [83]. Eventually, many countries make census data only publicly available for very large and often very heterogeneous areal units of sometimes more than 100,000 inhabitants [48,84].

2.2.2. Field-Based Mapping

Community-based mapping is commonly performed by nongovernment organizations (NGOs), such as Slum Dwellers International (SDI), but also as part of governmental slum mapping programs [85]. For example, the National Slum Upgrading Project in Indonesia developed a community-based slum mapping approach that combines survey-based methods with community involvement [51]. Often this approach is linked, in some way, to advocacy for slum dwellers’ recognition and rights. Field-based mapping has the advantage of strongly representing local context, area-level physical characteristics, and area-level social characteristics. In particular, when the mapping is done by the community, as well as the management of this data, the resulting data represents a rich source of contextual information and local context and provides the most appropriate base for validation (gold standard). However, this approach is challenging to scale, and the resulting deprived area maps can be very different across cities and countries. Risks of fines, harassment, and eviction in vulnerable communities are often mitigated by advocacy efforts linked with the mapping activities that also strongly focus on the assets of communities.

2.2.3. Human Imagery Classification Approach

Satellite, aerial, and drone imagery are sometimes used to manually classify deprived areas using their unique physical characteristics [48]. Human imagery classification is generally based on very-high resolution (VHR) imagery from satellites (up to 30 cm resolutions) available also as freely accessible RGB images (e.g., Google Earth), drones (e.g., 3 cm resolution), or low-flying aircraft providing substantial insights into local physical conditions. This approach is usually based on a priori definitions of deprived areas, for example, defining such areas as having high built-up density, irregular layout patterns, small or no internal access roads, small low-rise buildings, and lack of green spaces [9]. The use of imagery to classify deprived areas does not depend on the availability of predefined areal units. For this reason, this approach could provide a more accurate approximation of the actual boundaries of deprived areas [8]. Local experts often perform the manual delineation of these boundaries, and while it is a labor-intensive process, it can provide high-resolution and highly accurate maps for planning purposes. However, there may be inconsistencies in areas delineated by different experts [58], as they might disagree about the classification of complex urban environments [66,86,87] and, generally, omit the role of local actors (e.g., by ignoring local opinions, privacy, and geo-ethics).

2.2.4. Semi-Automatic Imagery Classification Approach

Semi-automatic “supervised” imagery classification is commonly performed on satellite, aerial, and drone imagery, using machine-learning and statistical models. Developments in this field show that well-trained models can achieve a high classification accuracy of more than 90% [61,66]. However, such methods, and more particularly deep learning methods, typically require a large number of high-quality training data. Moreover, they are computationally very demanding when it comes to processing imagery with high spatial detail. Consequently, most models tackle very small areas, much smaller than the extent of a city, to keep training and computational requirements low [66]. The semi-automatic imagery classification approach reflects physical characteristics in deprived areas, while typically ignoring area-level social characteristics. Based on physical attributes, this classification approach can produce results that are comparable across cities and countries when employing consistent methods and data. Given resources, computer-based models can also be updated frequently with the most recent imagery. In principle, this approach to deprived area modeling can be performed either as a categorical task (e.g., deprived/nondeprived binary classes) or a continuous task (e.g., “deprivation” index [61]), providing a continuous probability for small units within the area of interest.
The high data cost of commercial VHR images (defined as a spatial resolution of 1 m and below) and their availability (e.g., restricted by cloud coverage) are major obstacles for scalability and repeatability. Deprived area maps created with semi-automatic imagery classification, commonly created as pixel-based, object-based, or patch-based outputs, may include high uncertainties along boundaries [86]. Furthermore, a majority of image classification models do not account for disagreement among experts delineating the training data [87]. Existing semi-automatic imagery classification methods are mostly top-down, with no direct involvement of communities. This lack of involvement of local actors in deprived area mapping may increase the risk of receiving fines, harassment, or eviction for the most vulnerable communities. These issues can be addressed with models that classify deprived areas as a continuous task—that is, by classifying small areal units such as grid cells by their degree of “deprivation” [87].

2.3. Comparison of the Existing Deprived Area Mapping Approaches

The four approaches to deprived area mapping in Section 2.2 are not entirely siloed. Sometimes, the different approaches are used in sequence to validate or improve deprived area maps. For example, human image classifications or field-based mapping that might only cover a part of the city are used to train, validate, and test semi-automatic imagery classifications [70]. Figure 1 presents deprived area maps for Nairobi, Kenya based on the four different approaches to deprived area mapping. While there is agreement on the existence of deprived areas in certain parts of the city across the four approaches, the extent and boundaries of the mapped areas sharply differ. This disagreement can lead to over- and underestimation of slum areas across methods; for instance, the deprived areas mapped by SDI cover a surface of 10.93 km2, while the areas mapped through human image interpretation cover 17.51 km2 (possibly including areas that look deprived—called morphological slums by [88]—but might not be seen as deprived on the ground).
Deprived area maps derived from EO data can be of relatively high accuracy (typically ranging from 70% to 95% [10]); however, some areas may be incorrectly labeled as deprived, or some actual deprived areas may be omitted. Furthermore, showing crisp boundaries of deprived areas might cause misinterpretation of such maps and raise questioning of whether such maps should be made publicly available; for instance, maps could have severe consequences for vulnerable communities (e.g., evictions). Figure 2 compares a machine-learning-based identification of deprived areas using freely available Sentinel-2 image data with a manually delineated area map (in red) derived from VHR imagery (yellow outlines). The semi-automatic classification indicated at several locations the likelihood of small pockets of deprived areas, showing errors of commission and omission. However, at some locations, the computer detected small pockets correctly, which were omitted by the human interpreter (right zoom-in). Due to the relatively coarse resolution of the Sentinel-2 image (10 m), area boundaries are different from the manual delineation. This raises the question at what level of aggregation (scale) deprived area maps should be made available to which user groups and how to best communicate uncertainties in mapping products.

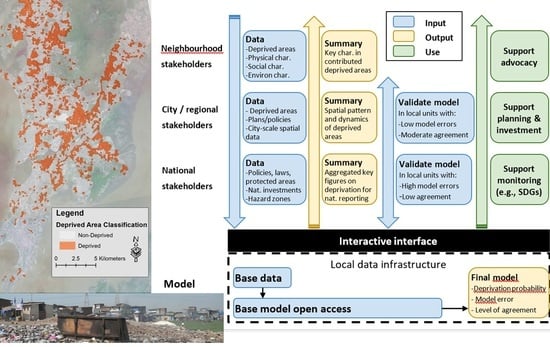
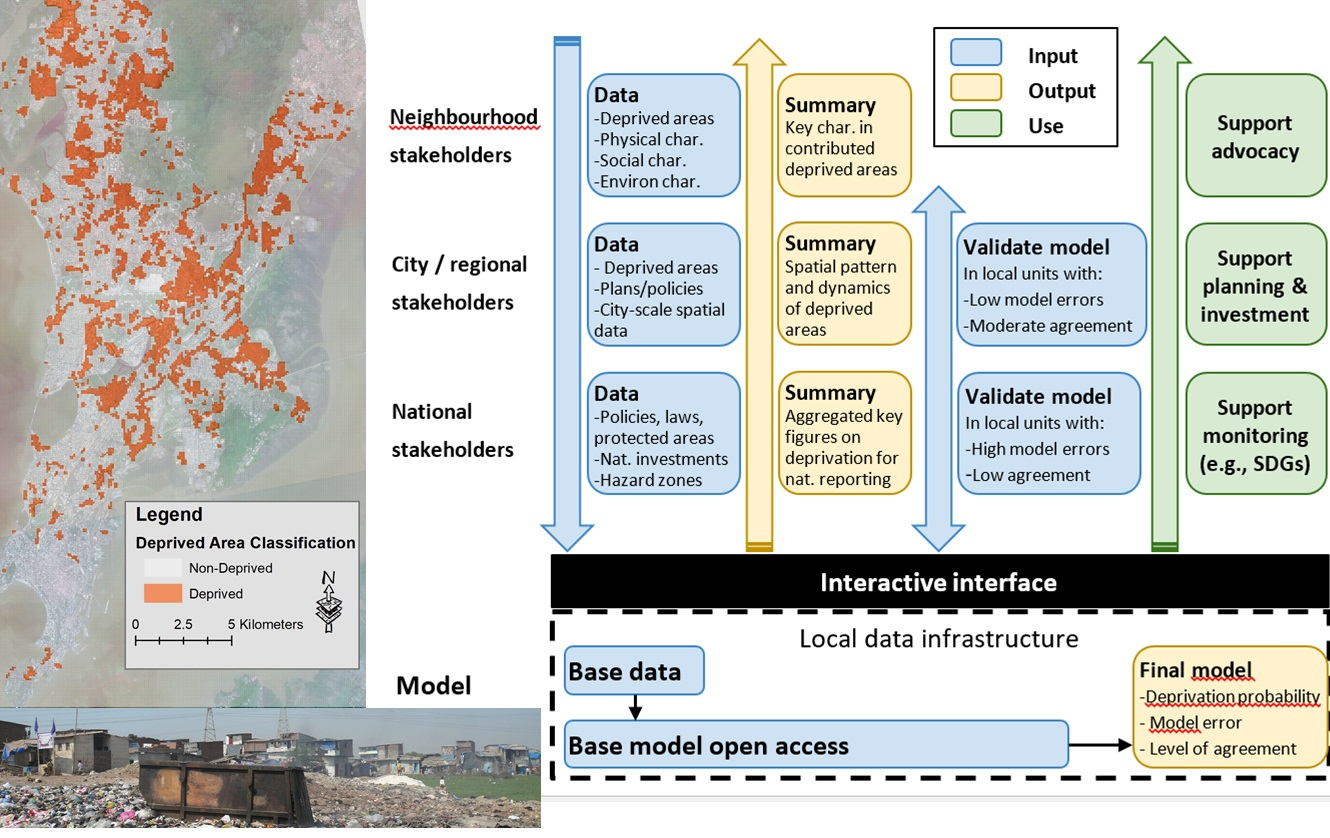
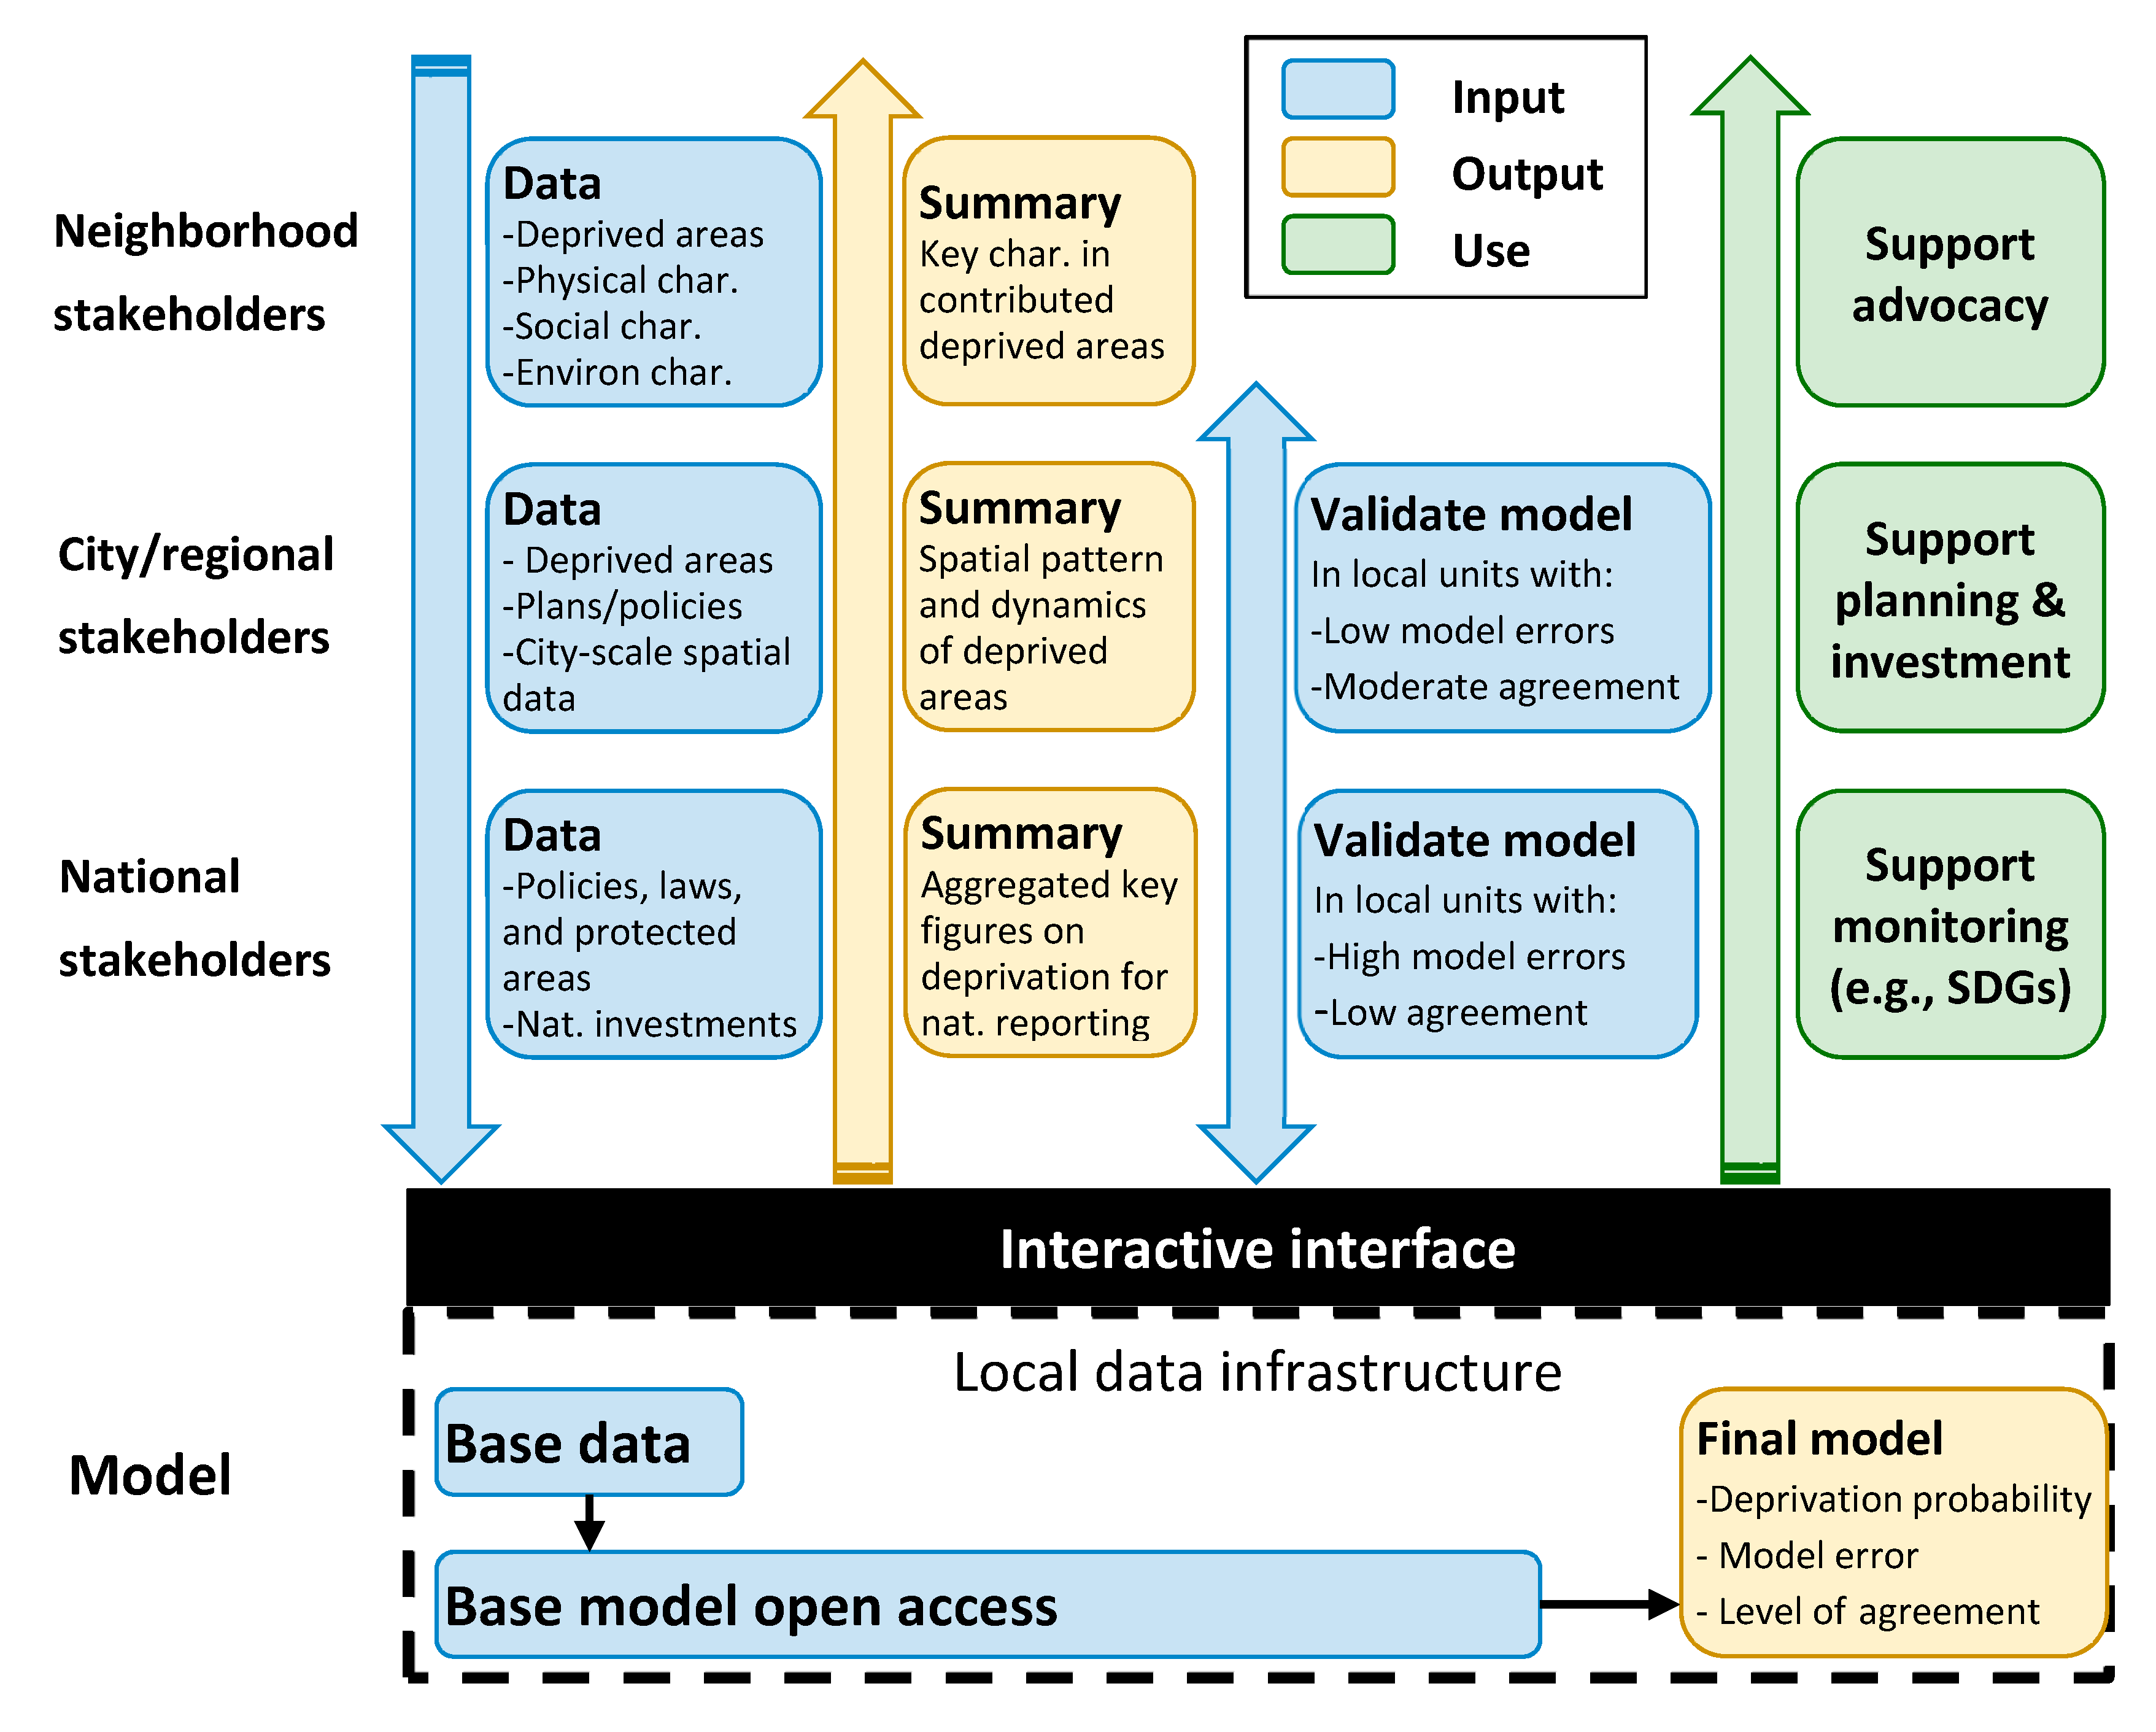
2.4. The Proposed IDeAMapS Framework

Figure 3 shows the proposed framework for IDeAMapS that combines EO data with community-based information into an open-access system. This figure shows the setup of the systems, its input information requirements, output, and usages at different levels (from communities to national and related global information needs). For example, data on the location and boundary of deprived areas’ detailed physical, social, and environmental characteristics are available at the neighborhood/community level. This information provides a detailed characterization of an area and supports community advocacy. Such data, when combined with machine-learning-based methods, allow for the development of maps at a city scale; however, such maps will provide much less detail and are more aggregated, e.g., supporting monitoring and strategic planning activities. The aggregated maps will also have a model error as compared to detailed community-based maps.
To deal with privacy and model errors, the different information needs at city and national scales, and the different types and resolution of physical and social datasets used as model covariates, the proposed IDeAMapS is meant to produce a high-resolution gridded dataset, where each grid cell is characterized by an estimated degree of “deprivation” (relating to differences in physical, environmental, and socioeconomic conditions (e.g., [61]). Gridded datasets offer high operational flexibility, because they can be aggregated within spatial or statistical units of different extents and scales, such as census enumeration areas or administrative units. Consequently, areal unit boundaries and toponyms are not explicitly embedded in the gridded data, thereby protecting the privacy and safety of the local communities. IDeAMapS will be available as a map service with a user interface (open accessed via the Web) that will allow users to classify the degree of “deprivation” into categorical area maps, by setting “deprivation” thresholds. To promote continuous improvement of the deprived area mapping system, the user interface will ask users to provide additional training data. For example, it will allow local actors to classify the cells where the model performs poorly as deprived or nondeprived. This information will be fed back into the model to continually improve its statistical performance and measure the level of agreement among local actors.
The user interface of IDeAMapS will be linked to a spatial data infrastructure containing physical and socioeconomic datasets; such datasets are fundamental to train and validate EO-based deprived area mapping methods, as well as identified slum area boundaries. Besides an open interface for aggregated outputs within a protected space, individuals or organizations will have control over their contributions, including the ability to retract contributed data at any point. Thus, the protected space will be password-protected but open to all groups of stakeholders, including national and local governments, community groups, NGOs, researchers, international agencies, and the general public. As such, the platform can be used for SDGs reporting, national, and local reporting and allow national statistical agencies to generate deprived area maps for supporting censuses and surveys. Moreover, to ensure the integrity of the data on deprived areas (e.g., from malicious actors that may intentionally provide false information), a subversioning unit will provide administrators with the ability to rollback inaccurate contributions/updates. This will be supported by a data analytics dashboard and automated reporting tools, including metadata management, to allow users to generate appropriate insights from data for their specific decision-making needs.

3. The Role of Earth Observation for the Design of an Integrated Deprived Area Mapping System

In this section, we review the literature published within the last three years (to update earlier reviews [10,12]), in the domain of EO to assess the progress in the field of deprived area mapping for planning and intervention (e.g., in the health sector). We also discuss the potential contributions towards IDeAMapS at the global scale.

3.1. The Most Promising Machine-Learning Methods towards an Integrated Deprived Area Mapping System

A systematic review of the literature on mapping deprived areas (i.e., slums and informal settlements) using EO-based data since 2016 identified 30 key peer-reviewed articles. The most common mapping methods are classical machine-learning (ML) (e.g., support vector machines and random forest) and CNNs, followed by rule-based object-based image analysis (OBIA) [67], human image interpretation, and statistics models (Figure 4). Most of the publications (60%) in the field of ML focus on small areas, much below the size of a city. At the scale of subcities, the potential of ML to support planning and decision-making required at the city or national scale (Figure 3) cannot be illustrated [1]. In particular, CNN-based methods focus on small areas due to the associated high computational requirements. The most common study area is the city of Mumbai, which is the focus of more than 20% of all publications (e.g., [52,54,56,91]). The reason for this is that deprived areas within the city have clear physical characteristics (i.e., deprived areas are commonly very compact, have little vegetation and cover large parts of the city) that can be easily identified through imagery classification approaches [92]. In general, almost 60% of all studies focus on Asian cities (typically the very large and mega-cities), around 20% on African cities, less than 10% on Latin American cities, and around 10% analyze transferability of cities across continents. Secondary cities are commonly not covered.
An increasing number of publications (around 30%) test deprived area mapping methods across different cities. Such transferability tests are essential to assess the generalization potential of a proposed method. A major bottleneck to assess the most suitable EO-based deprived area mapping methods is that of the inconsistency of the assessment metrics. The overall classification accuracy is often reported, and, in CNN-based methods, it can reach values above 90%. Conversely, the use of real ground-truth data (collected in the field) is not very common. Furthermore, the use of imagery interpretation data (delineated by human interpreters) in the validation step implies that models are trained and assessed according to what EO experts see as deprived (using evident visual physical characteristics). However, this does not necessarily match the on-the-ground reality of deprived areas. Figure 5 shows that, as in the case of Ahmedabad, historic city centers can have physically very similar characteristics in imagery as compared to deprived areas. Both areas have high built-up density, no green spaces, and irregular patterns.

3.2. Example Cases of Machine Learning for Deprived Area Mapping

To illustrate the potential of machine-learning to map city-level deprivation, several cases are used to illustrate the scope, as well as limitations, of state-of-the-art methods. For each case and approach, the pros and cons are discussed.

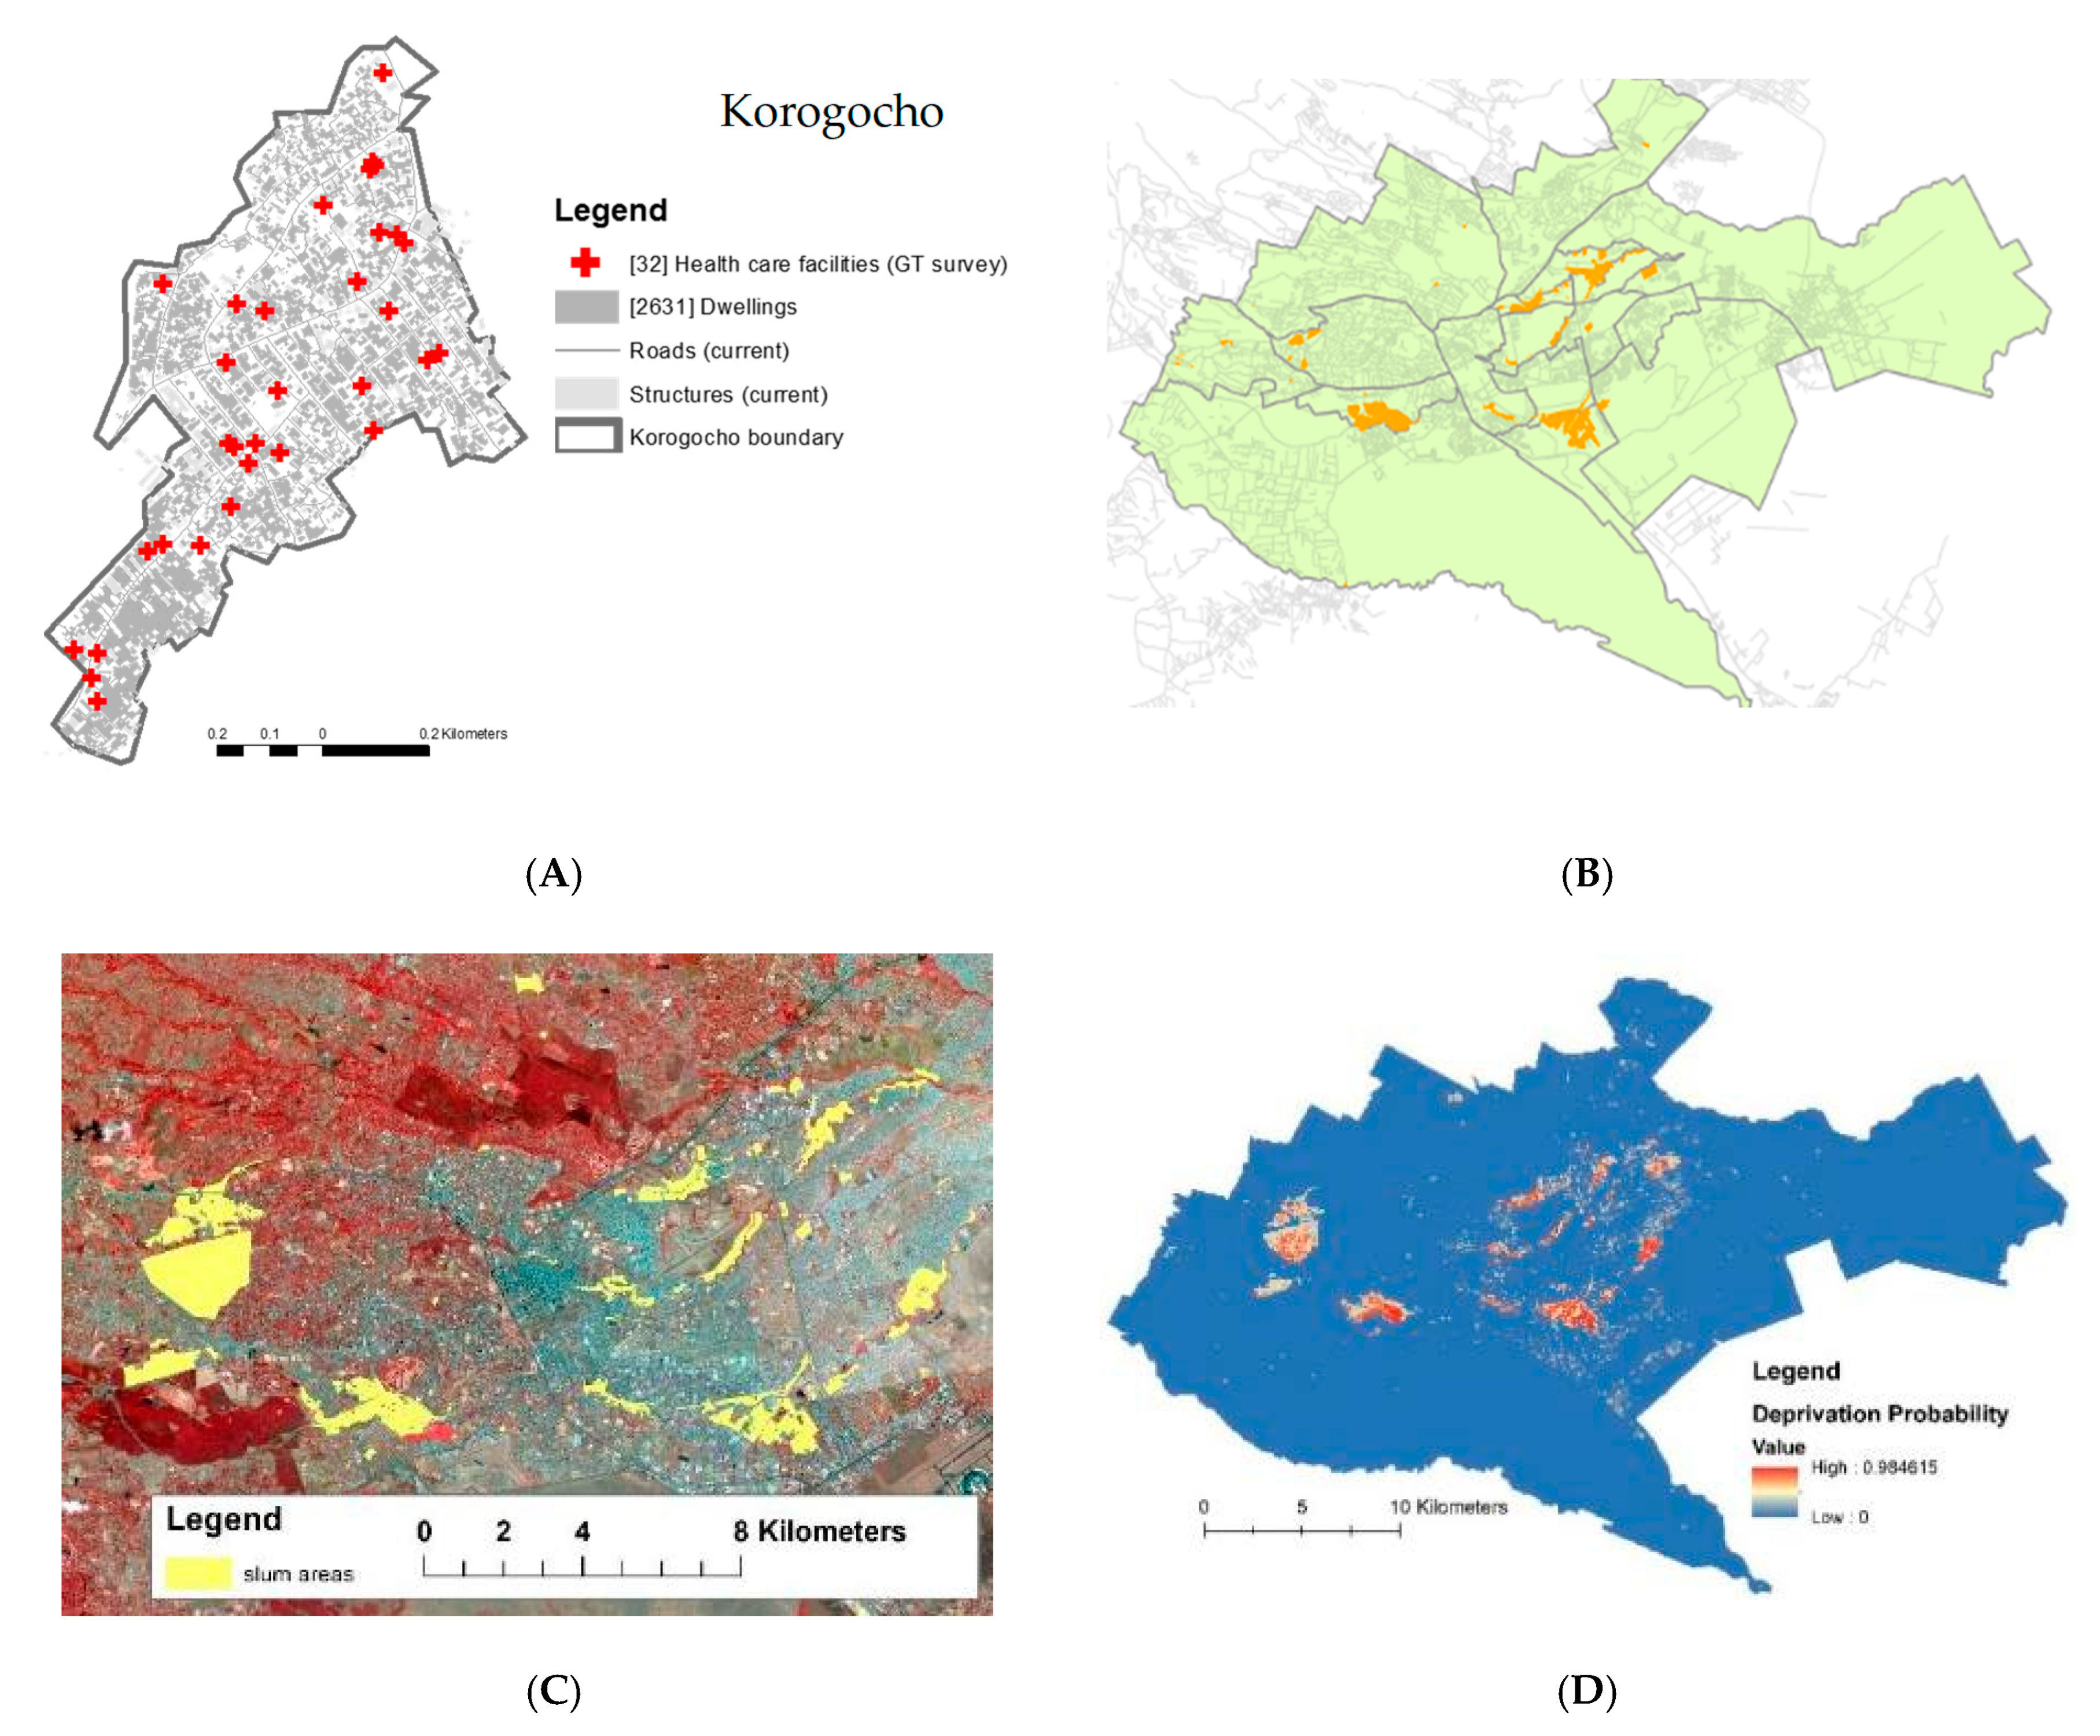
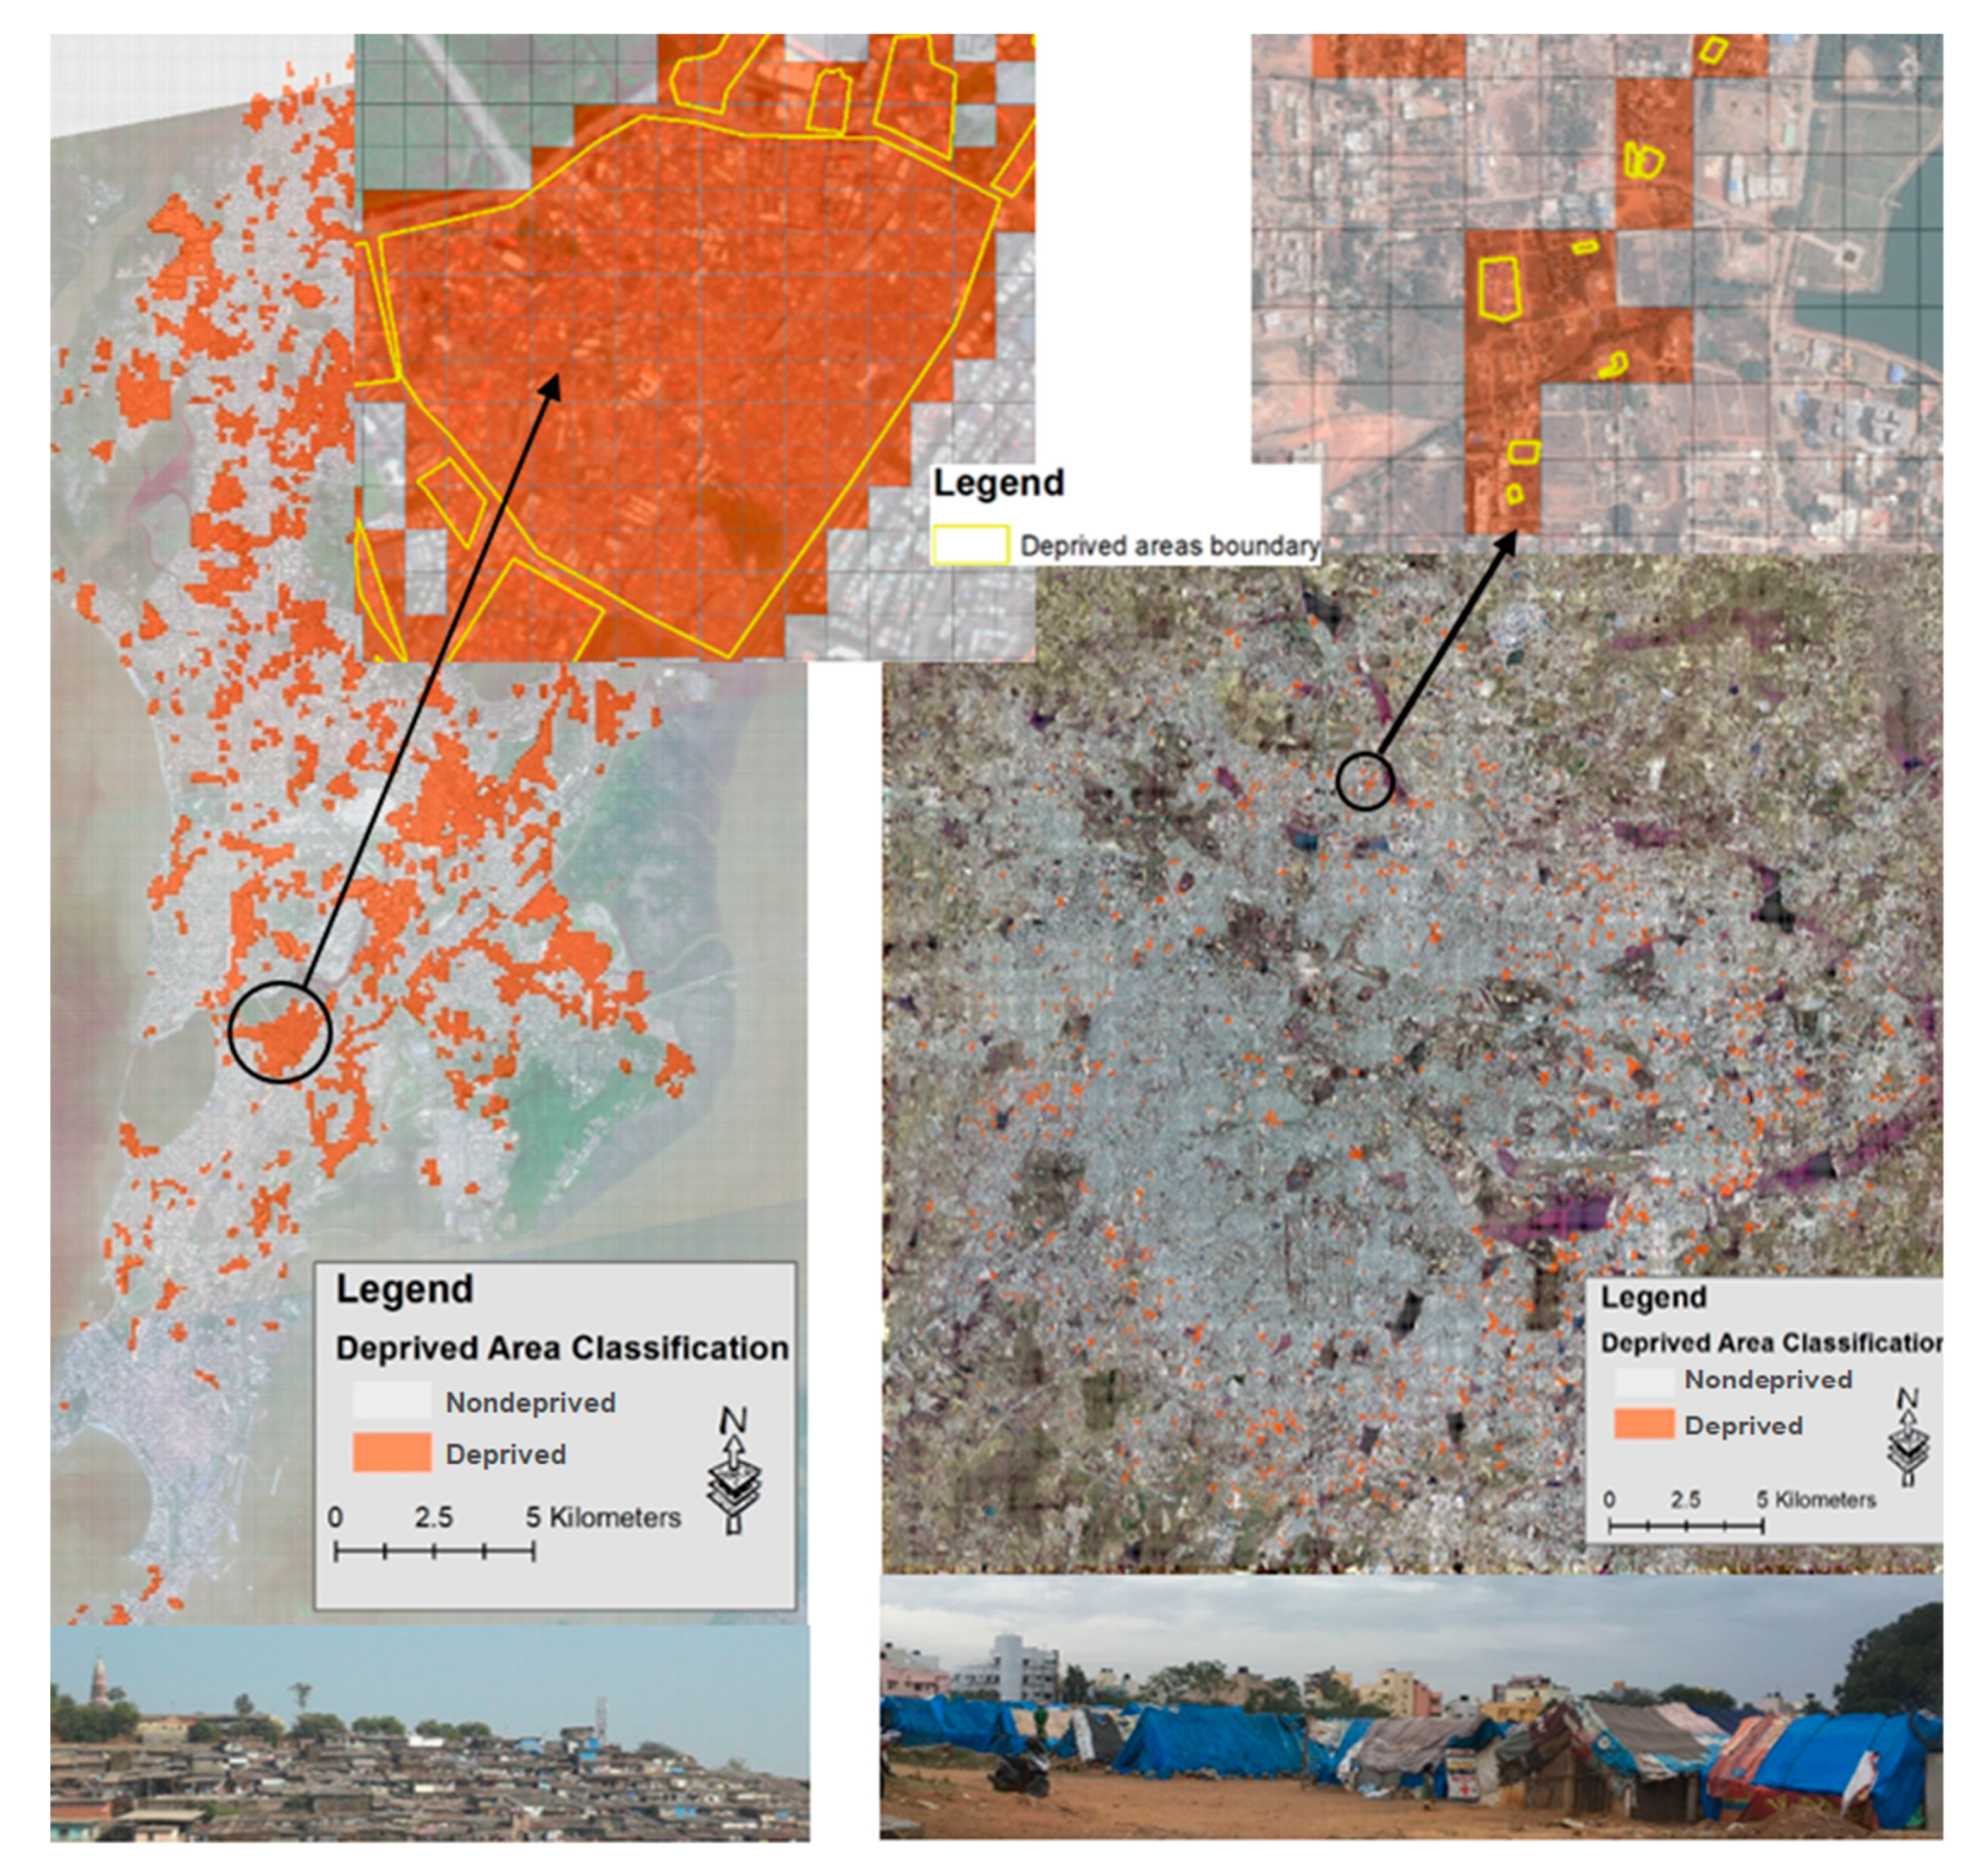
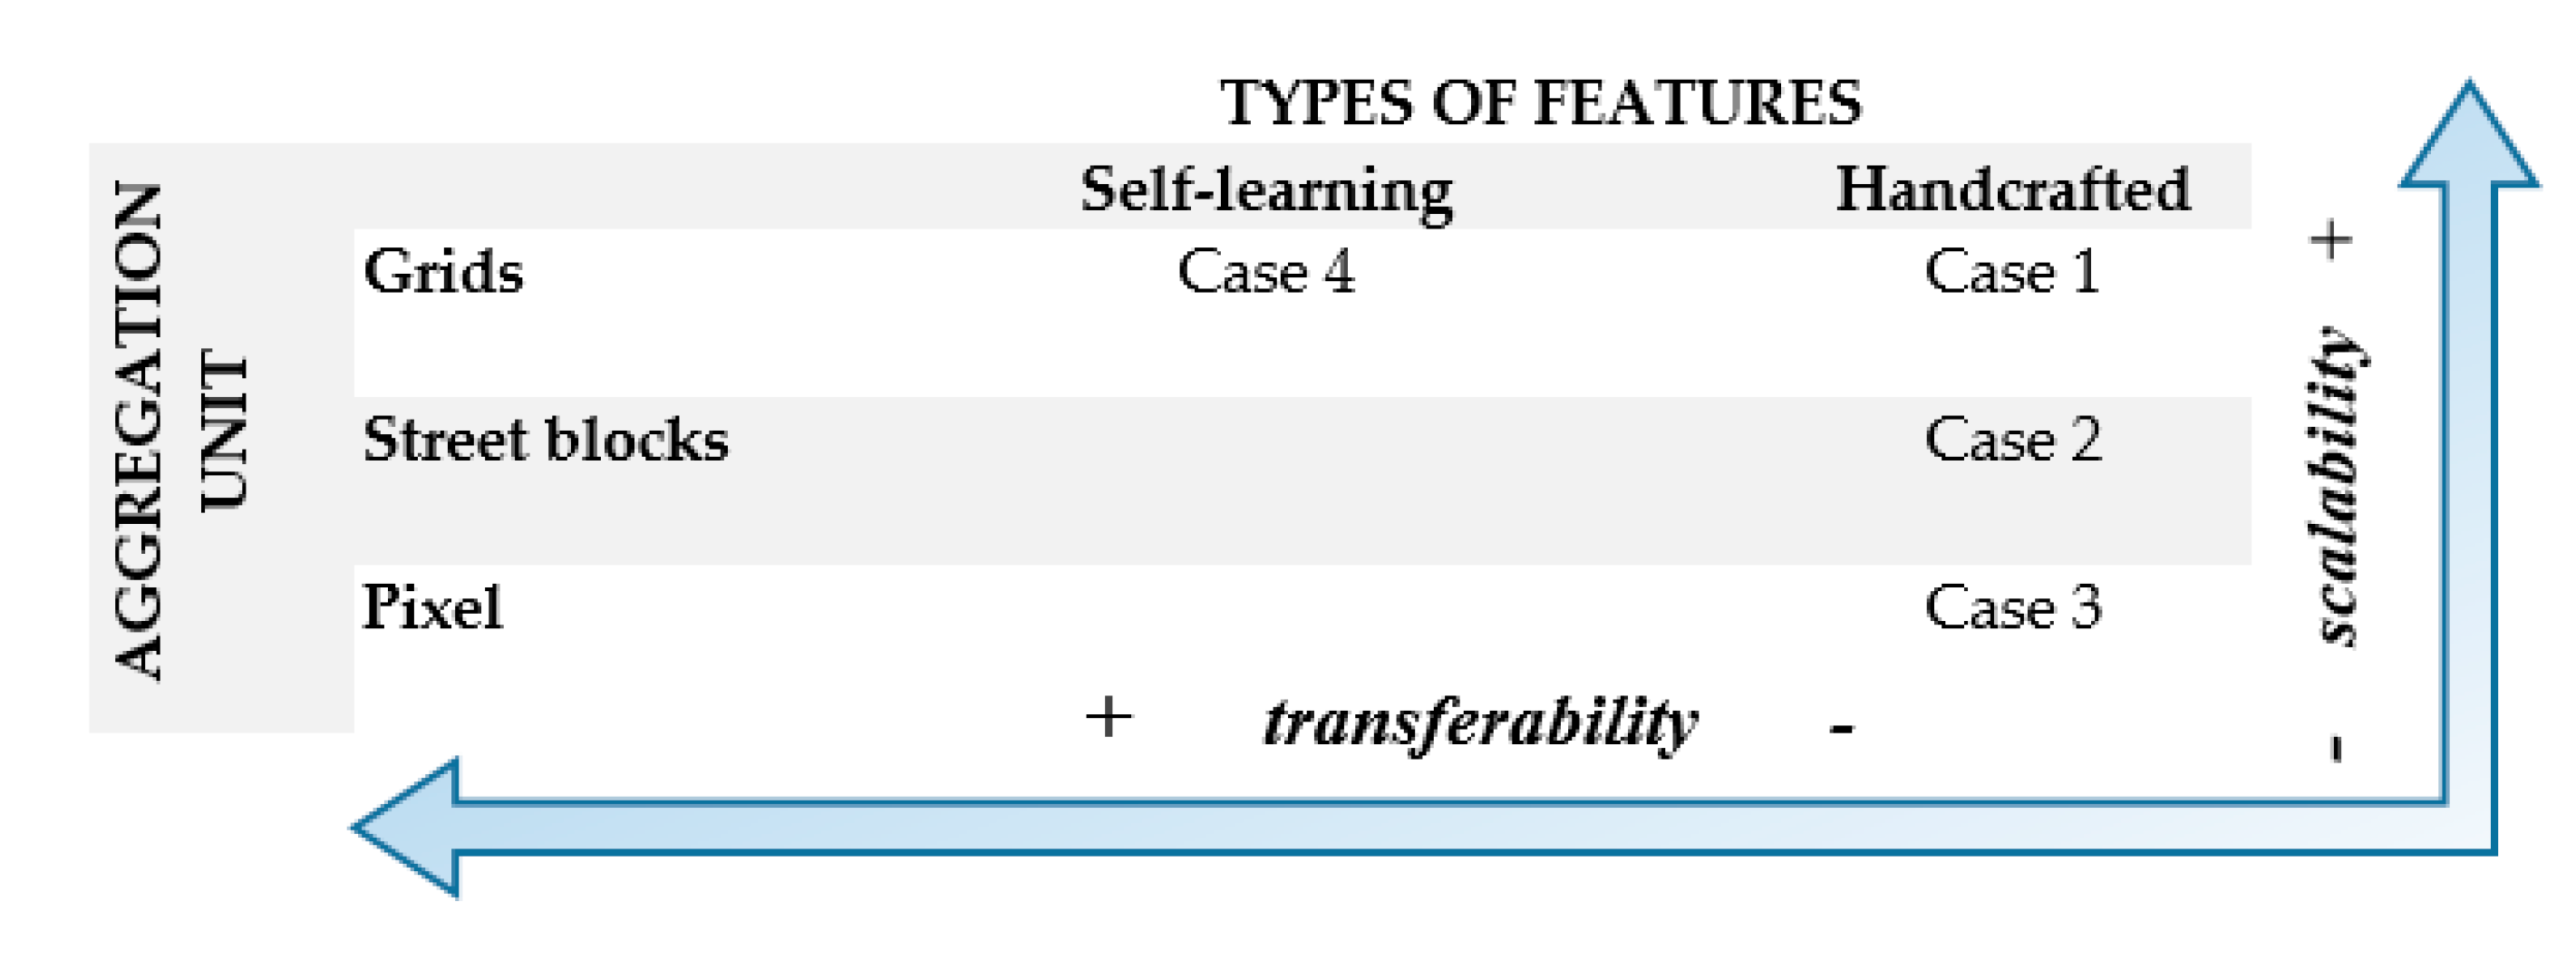
3.2.1. The Potential of High-Resolution Gridded Datasets to Map Deprived Areas (Case 1)

The GRID3 (Geo-Referenced Infrastructure and Demographic Data for Development) project aims, among others, at producing high-resolution population data in countries where the national census is outdated or unavailable. Population counts and demographic characteristics are estimated using a “bottom-up” modelling approach, linking microcensus survey data collected within small areas to spatial covariates associated with different contextual settings [83]. Given that urban context is shaped by different residential settings, deprived area mapping is deemed as a necessary step to reflect demographic patterns at high spatial resolution.
To better understand the distribution of deprived areas in LMICs, high-resolution gridded datasets are suitable to support scalability. Gridded data types involve overlaying a regular square grid on the study area, where each grid cell is an analytical unit. This reference unit enables the combination of a wide range of spatial (i.e., vector and raster) and nonspatial (i.e., tabular) datasets that can be accessed efficiently and consistently [93]. The analytical output is also in a gridded format, where the allocation of a “deprivation index” value to a grid cell does not involve assigning a label to a specific administrative unit but an areal unit, thus preventing neighborhood stigmatization. The resulting high-resolution deprived area map provides considerable accuracy and flexibility when producing administrative summaries within the same urban area and across cities.
This approach is tested for deprived area mapping in Kinshasa, the Democratic Republic of the Congo (Figure 6), a country where 75% of the population live in deprived areas [94]. As input data, we examined three types of gridded datasets with a 100 m × 100 m spatial resolution. First, we retrieved traditional EO products, such as NDVI, slope, and flood-prone areas, to provide insights into the environmental context associated with the presence of deprived areas [10]. Second, we accessed a number of fragmentation metrics based on building footprints retrieved from EO [95] to capture the morphological characteristics of deprived areas. Lastly, we produced indicators related to local road networks and access to services using OpenStreetMap data [96] to represent the social infrastructure of the city.
In total, 166 locations across Kinshasa were sampled using stratified sampling proportional to population size to capture the different demographic patterns across the city [97]. The selected input gridded datasets best approximated the spatial patterns of deprivation across the sampled locations as described by multiple local sources of information available online. This process allowed to retain the four most relevant datasets to be assessed in a factor analysis [98]. This analytical method was used to estimate a “deprivation index” for the city of Kinshasa, acting as a latent factor generating the selected, manifest gridded datasets. The model allowed to assess deprivation as a latent construct of spatial variables related to potential residential segregation but also to estimate a “deprivation index” across the urban area.
In addition to these analytical results, this modeling framework offers an innovative approach to address some of the limitations affecting current efforts in the domain of deprived area mapping [96]. The use of gridded datasets provides flexible spatial support to combine different physical and social datasets. Another advantage is to facilitate the inclusion of local knowledge in the process of variable selection, a process that can be updated with new information. However, given the context-specific characteristic of this approach, a multi-level factor analysis, including local- or country-level information provided by different stakeholders, should be implemented to scale the proposed analytical framework across urban areas in different countries.

3.2.2. The Potential of OBIA for Generating Land Cover Information and Mapping Deprived Areas at City-Block Level (Case 2)

In the MAUPP project (Modeling and forecasting African Urban Population Patterns for vulnerability and health assessments), a semi-automated method was developed for citywide mapping of land cover and land use (classifying types of built-up areas that included deprived areas). The methodology has two main steps. First, a land-cover classification is performed using VHR imagery. Then, the land use is predicted using spatial statistics computed based on the land cover within urban blocks. The land cover mapping framework combines OBIA and machine-learning (ML) [99], consisting of several steps: (1) image segmentation for generating groups of pixels (“segments”) that correspond as much as possible to real-world objects (e.g., one segment ideally corresponds to one building), (2) computation of image features and extraction of segment statistics, (3) feature selection and classification of the segments using supervised or unsupervised ML approaches, and (4) post-classification for improving the quality of the final map. The different processing steps were automatized, as far as possible. For example, image segmentation has a significant impact on the quality of classification results, and its automation has been well-addressed in the literature [100]. However, even in state-of-the-art methods, the segmentation parameters are generally optimized for whole scenes, which is not effective for citywide mapping that involves large images with a high degree of heterogeneity. Therefore, a local segmentation optimization was developed (spatially partitioned unsupervised segmentation parameter optimization [101]) that outperforms global approaches, both in terms of thematic and geometric accuracy [102].
The process for mapping the land cover is as follows: (1) The image is automatically divided into tiles of smaller size (e.g., 20 ha) using a cutline algorithm that finds optimal tile borders according to edges present in the landscape. (2) Each tile is segmented using locally optimized parameters for each tile. (3) Then, a set of image features is computed (e.g., vegetation indices, texture indices, and shape features), and segment statistics are extracted based on these features. (4) A set of labeled training data is created by experts using computer-assisted photo-interpretation (CAPI). (5) These labeled data are used to train a random forest (RF) classification algorithm. (5) Stitching the classified tiles together produces a seamless mosaic where the effect of the tiling is hardly visible.
The land use is predicted at the city block level [103], providing sufficient spatial detail, suitable for mapping urban functions. However, most of the time, city blocks do not exist in LMICs. Therefore, a method that automatically generates city blocks from OpenStreetMap (OSM) data was designed. All linear elements likely to correspond with limits (e.g., streets, border of residential areas, walls, rivers, and railways) are used to generate these blocks. The blocks are then characterized according to the proportion of each land-cover class and their spatial arrangement using spatial metrics. The prediction of the land use in urban blocks is performed using RF fed with a set of labeled data created using CAPI, containing five classes: planned residential areas, unplanned residential areas (deprived), nonresidential built-up areas, vegetation, and open land. The residential classes were then split into high- and low-density based on building density derived from the land-cover layer. This approach allowed for a clear distinction between deprived areas, characterized as “high-density unplanned residential areas”, and other built-up areas. The approach developed for the city of Ouagadougou, Burkina Faso was successfully transferred to other cities, such as Dakar, Senegal and Dar es Salaam, Tanzania, as illustrated in Figure 7. Both frameworks are based on free and open-source software (FOSS) and are available from a public repository under open-source license, making them fully reusable.
The main strength of this land-use mapping framework is that it models the land use in sufficient detail without relying on ancillary databases (e.g., cadastral, socioeconomic, location of urban facilities, retail, etc.) that are most of the time unavailable or outdated in LMICs. Furthermore, the processing is largely automated, making it transferable to other cities for mapping land use, including deprived areas. On the other hand, its main limitation is that the geometric quality of urban block polygons depends on the richness of OSM data, the latter being still limited for a number of cities. Another limitation is the involvement of manual labeling of training data for supervised machine-learning algorithms, being subjective and time-consuming.

3.2.3. Contextual Features for Mapping Deprived Areas (Case 3)

Deprived areas typically have a spatial pattern that allows them to be differentiated from the rest of the city [9]. Using this idea, [104] combined a number of computer vision algorithms together that characterize spatial patterns observed in VHR imagery over groups of pixels or neighborhoods to map informal settlements. These algorithms include the Histogram of Oriented Gradients (HOG), linear binary pattern moments (LBPM), line support regions (LSR), lacunarity, normalized difference vegetation index (NDVI), and many others. The idea behind this approach is to produce statistical quantification of edge patterns, pixel groups, gaps, textures, and the raw spectral signatures that are calculated over groups of pixels or neighborhoods. Together, these features can be described as contextual features. Results from this work indicated that these features could be used to map informal settlements with high accuracy in multiple cities around the world using decision trees [104]. Building on this work, [105] found that, using a similar approach, slums in Accra, Ghana can be mapped with high accuracy. Recently, this work has been extended to not only classifying areas but to aid in mapping poverty at both city and county scales, provided VHR imagery is available [106,107,108].
The main advantage of this approach is that the contextual features are computationally simple and relatively quick to process. Additionally, the scale of calculation can be adjusted based on the imagery or areas covered, and instead of classifying objects, the contextual features can be used directly in statistical models and provide continuous outputs [108]. The major drawback is the limited understanding of what the patterns the contextual features are picking up mean and how they vary from city to city. However, research is currently being conducted to help better understand the urban attributes environment contextual features are capturing [109].

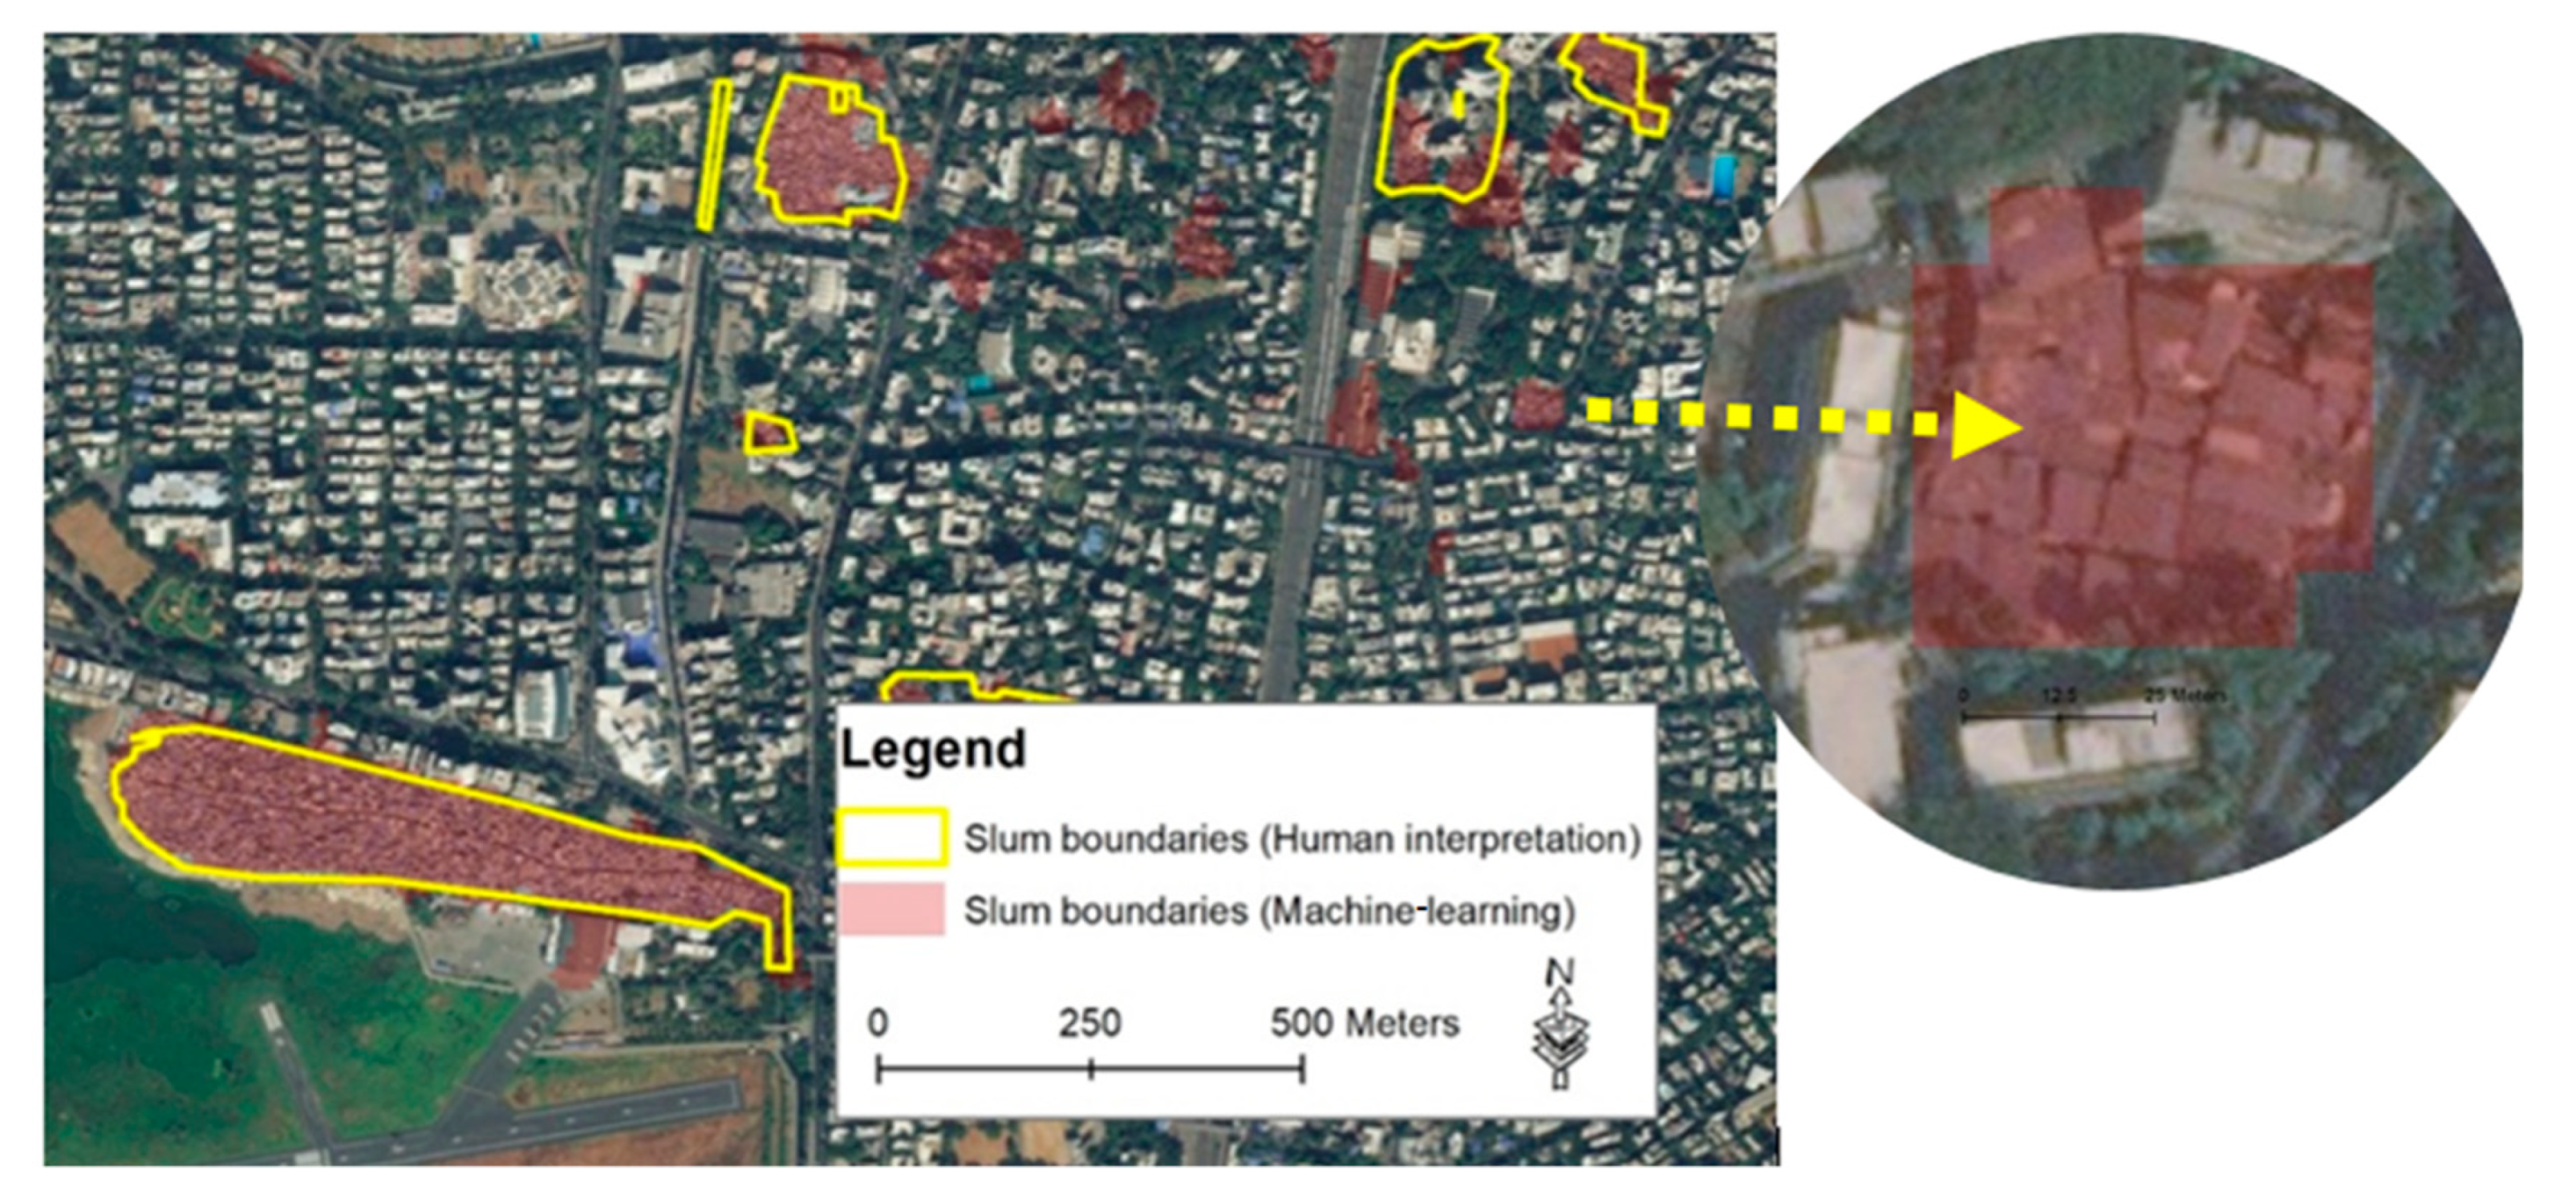
3.3. Deep Learning for Mapping Deprived Areas (Case 4)

Mapping the degree of “deprivation” using machine-learning and, in particular, deep learning can follow several main spatial approaches. Commonly, in CNNs, patches are labeled, while fully convolutional networks (FCNs) generate maps based on semantic segmentation that resamples the boundaries of deprived areas. When aiming at mapping boundaries of area objects, FCNs have an enormous advantage for local-level mapping [70]. However, for a global database of deprived areas, it will be more relevant not to display exact boundaries (to prevent or limit unintended harm for communities) but to provide a grid (patch)-based mapping product. A major question to be solved is: what is a suitable aggregation level to provide such maps? The example below shows deprived area maps for two Indian cities, Mumbai and Bangalore (Figure 8), using a 100 m × 100 m grid.
For the city of Mumbai, the census of 2011 reports around a 42% slum population. These deprived areas are relatively large and can be found across the urban landscape (Figure 5 left). In general, such areas are relatively well-covered by official statistics, as they are large and have often existed for many decades, which is very different in the city of Bangalore. In Bangalore, the census reports an 8% slum population, while the Karnataka Slum Development Board [110] officially counts 597 slums (around a 23% slum population), and a local survey mapped over 1500 slums [111]. The omitted deprived areas are particularly those that are small and temporary (see ground photo, lower right) [66]. Many cities do not account for unrecognized deprived areas, and particularly, the poorest sections of the population are commonly not counted. To map the boundaries of deprived areas effectively, VHR imagery (e.g., Pleiades or WorldView) with a resolution below 1 m is required. However, to produce more aggregated grid-based maps (examples are shown in Figure 8), HR imagery (e.g., Sentinel or Planetscope) having a spatial resolution of 10m and below are sufficient for many cities. The main risk of such HR grid-based approaches is that small deprived settlements might not be well-captured (as shown for the example of Bangalore).
In general, HR imagery allows identifying deprived areas on the basis of physical and morphological characteristics of urban structures [9]. Recent studies have shown that machine-learning and, in particular, convolutional neural networks (CNNs) are able to learn abstract hierarchical data representations directly from input imagery [112,113], achieving unprecedented classification accuracy [53,114,115,116,117] and optimizing the entire workflow. This means that CNNs do not require designing of hand-crafted features nor manual feature selection and can work with multi-resolution imagery and nonimage features (e.g., GIS-based features) [118]. However, providing a large amount of training data about deprived areas is challenging, and as a result, CNNs are not commonly used to map deprived areas at a city scale [66] but are restricted to small areas [53,114]. Dealing with the large training demand requires the combination of different mapping approaches and the construction of training databases with inputs from field-based maps. Besides binary mapping of deprivations, CNNs are also able to model the degree of deprivation, which has been shown in a recent study on Bangalore [61].

4. Discussion

EO-based methods have a great potential to contribute to SDG 11 “Making cities and human settlements inclusive, safe, resilient and sustainable”. For this purpose, we need to improve our understanding of deprivation across cities, using the unique potential of EO to develop a generic and transferable approach to characterize deprivation that meets the requirements of different user groups, ranging from local to global policy scales. However, EO-based literature lacks a clear understanding of what information is required by different user groups. Despite the increasing number of publications employing EO for mapping and monitoring deprivation, most stay within a single image analysis, on a single and geographically small case study. Such studies fail to provide information that is required by users (e.g., local and international organizations). Furthermore, existing studies fail to properly address the transferability of methods across cities, often being limited by the high cost of the commercial VHR imagery employed. There exists no systematic cost-benefit assessment of the influence of various spatial and spectral resolutions on mapping results. Moreover, there is little integration and exchange between community-based mapping (bottom-up) approaches and EO mapping (top-down) approaches. Deprived area mapping studies are often conducted without real ground truth data, e.g., employing visual image interpretation for generating training and validation data. However, there is an emerging consensus in the geospatial world that community involvement is necessary, which requires acknowledging the essential role communities play in defining relevant outputs, while the EO community has an essential role in providing scalable and transferable methods to allow for global mapping of urban deprivation.
To move forward from deprived area mapping studies on small areal units towards national and global mapping of deprivation, gridded mapping approaches will be the most suitable option (Figure 9). For local-level mapping that captures the urban morphology well, e.g., OBIA combined with city blocks defined by the road network, is very suitable to capture details on the urban morphology (e.g., Case 2). However, to ease computational requirements and to consider the data gaps in road networks of many urban areas in the Global South (e.g., often the roads in central parts of large cities are well-covered but not in the outskirt or secondary cities), a gridded mapping system will be more suitable (e.g., Cases 1 and 4). Furthermore, reliable population estimates are required in support of policy-relevant information (e.g., the SDG 11.1.1 indicator measures the percentage of the population living in deprived areas, not the area). Presently available global population models (e.g., WorldPop or LandScan) that combine census, spatial and RS data [119,120] suffer from high uncertainties in deprived areas [121], as they do not have built-up models to account for the often extremely high population density in such areas.
To support existing large-scale and long-term information needs, IDeAMapS was collaboratively designed to combine both bottom-up and top-down mapping methods, with an open invitation to contribute to its continued development. The role of EO in IDeAMapS will be to provide global and national gridded base maps on the location and degree of deprivation. In general, EO studies (e.g., [50,63,69,88,114]) have shown the potential of satellite imagery to provide consistent, accurate, and timely information on the location of deprived areas. VHR imagery can map and characterize deprivation [91], employing hand-crafted image features which require local adaptation (e.g., [50,91]); transferable image features (e.g., GLCM, vegetation indices, line, structural, and morphological features) [107]; or CNNs that self-define the most adapted image features (e.g., [56,70]). However, EO can only capture aspects of the physical deprivation and use image-based proxies to model other domains of deprivation (e.g., social, human, and economic). For example, a major gap is the missing social covariates. In general, geospatial data on social deprivation is collected by demographers, planners, and communities, but such data is not well-integrated with EO-based methods; here, the EO community might have a role to play in integrating and scaling these datasets. Thus, IDeAMapS will allow supporting local authorities in the development of improvement strategies for their poorest inhabitants but also supporting NGOs to advocate for the rights of inhabitants. For example, in some cities, long-standing national and municipal policies that maintain the invisibility of deprived areas mean that inhabitants face evictions or replacement when large projects are started [122,123]. NGOs (e.g., Slum Dwellers International) seek to address these challenges, and spatial data is essential to such challenges [47]. However, there is a clear communication gap between the RS community not understanding user requirements and the user community not understanding the scope of this rapidly developing technology. Furthermore, many challenges relating to technology and resources have yet to be addressed towards the development of IDeAMapS, but they are surmountable. IDeAMapS will be a system that is flexible and safe enough to be acceptable for communities and government users, that addresses issues of data security and privacy, and that has positive impacts for slum dwellers as an instrument for advocacy and for easing the communication and knowledge exchange with government bodies.

5. Conclusions

Spatial data on deprived areas in cities across the globe is typically limited and is often omitted in official statistics. Yet, such spatial data are urgently required for monitoring, humanitarian response, health campaigns, and in support of urban surveys and sampling. The proposed IDeAMapS framework aims at developing a system to provide consistent spatial data of deprived areas in the form of gridded datasets that can easily be integrated with other existing local, national, and global data layers. Such a system needs to be flexible and fulfill user needs at different scales (from local to global), while addressing the privacy of communities. It will allow overlaying environmental data on risks (e.g., climate change risks), pollution (e.g., air pollution), health data (e.g., child health), and various other data layers to better understand local conditions, assets, and progress towards making cities inclusive, safe, resilient, and sustainable places. It will be important to map not only deprivation levels but to combine such data with information on local assets of communities for a better understanding of the progress towards global and local development goals.

Author Contributions

Conceptualization, M.K., D.R.T., G.B., R.M., S.V., R.E., J.P.D.A., C.K., R.N. and J.M.; methodology, M.K., D.R.T., G.B., R.M., T.G., S.V., R.E., J.P.D.A., C.K., R.N., J.M. and E.D.; validation, M.K., G.B., T.G., S.V., R.E. and E.D.; formal analysis, M.K., G.B., T.G., S.V., R.E. and E.D.; writing—original draft preparation, M.K., D.R.T., G.B., R.M., T.G., S.V., R.E. and J.P.D.A.; and writing—review and editing, M.K., D.R.T., G.B., R.M., T.G., S.V. and R.E. All authors have read and agreed to the published version of the manuscript.

Funding

The research pertaining to these results received financial aid from the Federal Science Policy according to the agreement of subsidy no. (SR/11/380) (SLUMAP: http://slumap.ulb.be/) and from NWO grant number VI. Veni. 194.025.

Acknowledgments

We would like to thank the following people for their contributions in the form of feedback in workshops and meetings: Daniel Githira, Donatien Beguy, Julius Majale, Walter Oriedo, Kerstin Sommer, Daniela Di Filippo, and Faith Barorot from UN-Habitat; Martino Pesaresi, Sergio Freire and Alice Siragusa from the European Commission Joint Research Centre; Blessing Mberu from the African Population & Health Research Center; Beatrice Hati and Nicera Wanjiru from SDI; Andrew Tatem from the WorldPop Team at the University of Southampton; Peter Elias from the University of Lagos; Richard Sliuzas from ITC, University of Twente; Nale Mudau from Sansa; Steven Ramage from the Group on Earth Observations; and Philipp Ulbrich and Godwin Yeboah from the Institute for Global Sustainable Development at the University of Warwick.

Conflicts of Interest

The authors declare no conflicts of interest.

References

  1. Almanac, S. Tracking Improvement in the Lives of Slum Dwellers; UN-Habitat. UNION, Publishing Services Section: Nairobi, Kenya, 2015. [Google Scholar]
  2. Heilig, G.K. World Urbanization Prospects; the 2018 Revision; United Nations, Department of Economic and Social Affairs (DESA), Population Division, Population Estimates and Projections Section: New York, NY, USA, 2019. [Google Scholar]
  3. UN Department of Economic and Social Affairs Population Division. World Urbanization Prospects; 2014 Revision; United Nations: New York, NY, USA, 2014. [Google Scholar]
  4. UN-Habitat; UN Statistics Division; Cities Alliance. Secure Tenure, Slums and Global Sample of Cities. In Proceedings of the Expert Group Meeting on Urban Indicators, Nairobi, Kenya, 28–30 October 2002. [Google Scholar]
  5. Sliuzas, R.; Mboup, G.; de Sherbinin, A. Report of the Expert Group Meeting on Slum Identification and Mapping; CIESIN, UN-Habitat, ITC: Enschede, The Netherlands, 2008. [Google Scholar]
  6. UN-Habitat. Distinguishing Slum from Non-Slum Areas to Identify Occupants’ Issues. Available online: https://unhabitat.org/distinguishing-slum-from-non-slum-areas-to-identify-occupants-issues/ (accessed on 7 December 2017).
  7. Mahabir, R.; Crooks, A.; Croitoru, A.; Agouris, P. The study of slums as social and physical constructs: Challenges and emerging research opportunities. Reg. Stud. Reg. Sci. 2016, 3, 399–419. [Google Scholar] [CrossRef] [Green Version]
  8. Lilford, R.; Kyobutungi, C.; Ndugwa, R.; Sartori, J.; Watson, S.I.; Sliuzas, R.; Kuffer, M.; Hofer, T.; Porto de Albuquerque, J.; Ezeh, A. Because space matters: Conceptual framework to help distinguish slum from non-slum urban areas. BMJ Glob. Health 2019, 4, e001267. [Google Scholar] [CrossRef] [PubMed]
  9. Kohli, D.; Sliuzas, R.V.; Kerle, N.; Stein, A. An ontology of slums for image-based classification. Comput. Environ. Urban Syst. 2012, 36, 154–163. [Google Scholar] [CrossRef]
  10. Kuffer, M.; Pfeffer, K.; Sliuzas, R. Slums from space—15 years of slum mapping using remote sensing. Remote Sens. 2016, 8, 455. [Google Scholar] [CrossRef] [Green Version]
  11. Kuffer, M.; Barros, J.; Sliuzas, R. The development of a morphological unplanned settlement index using very-high-resolution (VHR) imagery. Comput. Environ. Urban Syst. 2014, 48, 138–152. [Google Scholar] [CrossRef]
  12. Mahabir, R.; Croitoru, A.; Crooks, A.; Agouris, P.; Stefanidis, A. A critical review of high and very high-resolution remote sensing approaches for detecting and mapping slums: Trends, challenges and emerging opportunities. Urban Sci. 2018, 2, 8. [Google Scholar] [CrossRef] [Green Version]
  13. Nuissl, H.; Heinrichs, D. Slums: Perspectives on the definition, the appraisal and the management of an urban phenomenon. DIE ERDE J. Geogr. Soc. Berl. 2013, 144, 105–116. [Google Scholar]
  14. UN-Habitat. Slums: Some Definitions. Available online: http://mirror.unhabitat.org/documents/media_centre/sowcr2006/SOWCR (accessed on 22 March 2018).
  15. UN-Habitat. Slums of the World: The Face of Urban Poverty in the New Millennium; UN-HABITAT: Nairobi, Kenya, 2003; p. 90. [Google Scholar]
  16. Snyder, R.E.; Jaimes, G.; Riley, L.W.; Faerstein, E.; Corburn, J. A Comparison of Social and Spatial Determinants of Health between Formal and Informal Settlements in a Large Metropolitan Setting in Brazil. J. Urban Health 2014, 91, 432–445. [Google Scholar] [CrossRef] [PubMed] [Green Version]
  17. Fink, G.; Günther, I.; Hill, K. Slum residence and child health in developing countries. Demography 2014, 51, 1175–1197. [Google Scholar] [CrossRef]
  18. Patel, A.; Koizumi, N.; Crooks, A. Measuring slum severity in Mumbai and Kolkata: A household-based approach. Habitat Int. 2014, 41, 300–306. [Google Scholar] [CrossRef]
  19. Engstrom, R.; Ofiesh, C.; Rain, D.; Jewell, H.; Weeks, J.R. Defining neighborhood boundaries for urban health research in developing countries: A case study of Accra, Ghana. J. Maps 2013, 9, 36–42. [Google Scholar] [CrossRef] [PubMed] [Green Version]
  20. UN-Habitat. Urban Inequities Report: Addis Ababa; UNON Publishing Services Section: Addis Ababa, Ethiopia, 2004. [Google Scholar]
  21. Lemma, T.; Sliuzas, R.; Kuffer, M. Participatory Approach to Monitoring Slum Conditions: An Example from Ethiopia. In Mapping for Change: Practice, Technologies and Communication: Proceedings of the International Conference on Participatory Spatial Information Management and Communication; Rambaldi, G., Corbett, J., Olson, R., McCall, M., Muchemi, J., Kyem, P., Weiner, D., Chambers, R., Eds.; IIED: London, UK, 2006; Volume 54, pp. 58–66. [Google Scholar]
  22. Brito, P.L.; Arenas, H.; Lam, N.; Quintanilha, J.A. Recognition of urban patterns related to leptospirosis contamination risks using object based classification of aerial photography. Test areas: Informal settlements of the railroad suburb of salvador, Brazil. In Proceedings of the International Geoscience and Remote Sensing Symposium (IGARSS), Boston, MA, USA, 8–11 July 2008; Volume 1, pp. I272–I275. [Google Scholar]
  23. Ezeh, A.; Oyebode, O.; Satterthwaite, D.; Chen, Y.-F.; Ndugwa, R.; Sartori, J.; Mberu, B.; Melendez-Torres, G.J.; Haregu, T.; Watson, S.I.; et al. The history, geography, and sociology of slums and the health problems of people who live in slums. Lancet 2017, 389, 547–558. [Google Scholar] [CrossRef]
  24. Mishra, S.; Kuffer, M.; Martinez, J.; Pfeffer, K. An Exploration of Environmental Quality in the context of Multiple Deprivations: The Case of Kalyan-Dombivli, India. In GIS in Sustainable Urban Planning and Management: A Global Perspective; van Maarseveen, M., Martinez, J., Flacke, J., Eds.; Taylor & Francis, CRC Press: Boca Raton, FL, USA, 2018; pp. 45–62. [Google Scholar]
  25. Georganos, S.; Gadiaga, A.N.; Linard, C.; Grippa, T.; Vanhuysse, S.; Mboga, N.; Wolff, E.; Dujardin, S.; Lennert, M. Modelling the Wealth Index of Demographic and Health Surveys within Cities Using Very High-Resolution Remotely Sensed Information. Remote Sens. 2019, 11, 2543. [Google Scholar] [CrossRef] [Green Version]
  26. UNFPA. UNFPA Strategy for the 2020 Round of Population & Housing Censuses (2015–2024): Because Everyone Counts; UNFPA Inter-Divisional Working Group on Census (IDWG-Census): New York, NY, USA, 2017. [Google Scholar]
  27. United Nations Statistics Division. The Sustainable Development Goals Report. 2018. Available online: https://unstats.un.org/sdgs/report/2018/overview/ (accessed on 9 December 2019).
  28. Andries, A.; Morse, S.; Murphy, R.; Lynch, J.; Woolliams, E.; Fonweban, J. Translation of Earth observation data into sustainable development indicators: An analytical framework. Sustain. Dev. 2019, 27, 366–376. [Google Scholar] [CrossRef] [Green Version]
  29. SDG Knowledge Platform. Sustainable Development Goal 11. Available online: https://sustainabledevelopment.un.org/sdg11 (accessed on 29 June 2019).
  30. Angeles, G.; Lance, P.; Barden-O’Fallon, J.; Islam, N.; Mahbub, A.Q.M.; Nazem, N.I. The 2005 census and mapping of slums in Bangladesh: Design, select results and application. Int. J. Health Geogr. 2009, 8, 19. [Google Scholar] [CrossRef] [Green Version]
  31. Pedro, A.A.; Queiroz, A.P. Slum: Comparing municipal and census basemaps. Habitat Int. 2019, 83, 30–40. [Google Scholar] [CrossRef]
  32. Carr-Hill, R. Missing millions and measuring development progress. World Dev. 2013, 46, 30–44. [Google Scholar] [CrossRef]
  33. Lucci, P.; Bhatkal, T.; Khan, A. Are we underestimating urban poverty? World Dev. 2018, 103, 297–310. [Google Scholar] [CrossRef]
  34. Elsey, H.; Thomson, D.R.; Lin, R.Y.; Maharjan, U.; Agarwal, S.; Newell, J. Addressing Inequities in Urban Health: Do Decision-Makers Have the Data They Need? Report from the Urban Health Data Special Session at International Conference on Urban Health Dhaka 2015. J. Urban Health Bull. N. Y. Acad. Med. 2016, 93, 526–537. [Google Scholar] [CrossRef] [Green Version]
  35. Kuffer, M.; Orina, F.; Sliuzas, R.; Taubenböck, H. Spatial patterns of slums: Comparing African and Asian cities. In Proceedings of the Joint urban remote sensing event (JURSE), Dubai, UAE, 6–8 March 2017. [Google Scholar]
  36. Gruebner, O.; Sachs, J.; Nockert, A.; Frings, M.; Khan, M.H.; Lakes, T.; Hostert, P. Mapping the slums of Dhaka from 2006 to 2010. Dataset Pap. Sci. 2014, 2014, 172182. [Google Scholar] [CrossRef] [Green Version]
  37. Kohli, D.; Sliuzas, R.; Stein, A. Urban slum detection using texture and spatial metrics derived from satellite imagery. J. Spat. Sci. 2016, 61, 405–426. [Google Scholar] [CrossRef] [Green Version]
  38. Stow, D.A.; Lopez, A.; Lippitt, C.; Hinton, S.; Weeks, J. Object-based classification of residential land use within Accra, Ghana based on QuickBird satellite data. Int. J. Remote Sens. 2007, 28, 5167–5173. [Google Scholar] [CrossRef] [PubMed]
  39. Weeks, J.R.; Getis, A.; Stow, D.A.; Hill, A.G.; Rain, D.; Engstrom, R.; Stoler, J.; Lippitt, C.; Jankowska, M.; Lopez-Carr, A.C.; et al. Connecting the dots between health, poverty, and place in Accra, Ghana. Ann. Assoc. Am. Geogr. 2012, 102, 932–941. [Google Scholar] [CrossRef] [PubMed] [Green Version]
  40. Twigg, J. Disaster Risk Reduction; Overseas Development Institute: London, UK, 2015. [Google Scholar]
  41. Bramante, J.F.; Raju, D.K. Predicting the distribution of informal camps established by the displaced after a catastrophic disaster, Port-au-Prince, Haiti. Appl. Geogr. 2013, 40, 30–39. [Google Scholar] [CrossRef]
  42. Abbott, J. The use of GIS in informal settlement upgrading: Its role and impact on the community and on local government. Habitat Int. 2003, 27, 575–593. [Google Scholar] [CrossRef]
  43. Shekhar, S. Improving the slum planning through geospatial decision support system. Int. Arch. Photogramm. Remote Sens. Spat. Inf. Sci. 2014, XL-2, 99–105. [Google Scholar] [CrossRef] [Green Version]
  44. Chitekwe-Biti, B.; Mudimu, P.; Nyama, G.M.; Jera, T. Developing an informal settlement upgrading protocol in Zimbabwe—The Epworth story. Environ. Urban. 2012, 24, 131–148. [Google Scholar] [CrossRef] [Green Version]
  45. Bakibinga, P.; Kabaria, C.; Kyobutungi, C.; Manyara, A.; Mbaya, N.; Mohammed, S.; Njeri, A.; Azam, I.; Iqbal, R.; Mazaffar, S.; et al. A protocol for a multi-site, spatially-referenced household survey in slum settings: Methods for access, sampling frame construction, sampling, and field data collection. BMC Med. Res. Methodol. 2019, 19, 109. [Google Scholar]
  46. Makau, J.; Dobson, S.; Samia, E. The five-city enumeration: The role of participatory enumerations in developing community capacity and partnerships with government in Uganda. Environ. Urban. 2012, 24, 31–46. [Google Scholar] [CrossRef]
  47. Beukes, A. Making the Invisible Visible: Generating Data on ‘Slums’ at Local, City and Global Scales; International Institute for Environment and Development: London, UK, 2015. [Google Scholar]
  48. Baud, I.; Kuffer, M.; Pfeffer, K.; Sliuzas, R.V.; Karuppannan, S. Understanding heterogeneity in metropolitan India: The added value of remote sensing data for analyzing sub-standard residential areas. Int. J. Appl. Earth Obs. Geoinf. 2010, 12, 359–374. [Google Scholar] [CrossRef]
  49. Anurogo, W.; Lubis, M.Z.; Pamungkas, D.S.; Hartono; Ibrahim, F.M. A Spatial Approach to Identify Slum Areas in East Wara Sub-Districts, South Sulawesi. IOP Conf. Ser. Earth Environ. Sci. 2017, 98, 012030. [Google Scholar] [CrossRef] [Green Version]
  50. Duque, J.C.; Patino, J.E.; Betancourt, A. Exploring the Potential of Machine Learning for Automatic Slum Identification from VHR Imagery. Remote Sens. 2017, 9, 895. [Google Scholar] [CrossRef] [Green Version]
  51. Leonita, G.; Kuffer, M.; Sliuzas, R.; Persello, C. Machine Learning-Based Slum Mapping in Support of Slum Upgrading Programs: The Case of Bandung City, Indonesia. Remote Sens. 2018, 10, 1522. [Google Scholar] [CrossRef] [Green Version]
  52. Verma, D.; Jana, A.; Ramamritham, K. Transfer learning approach to map urban slums using high and medium resolution satellite imagery. Habitat Int. 2019, 88, 101981. [Google Scholar] [CrossRef]
  53. Mboga, N.O.; Persello, C.; Bergado, J.; Stein, A. Detection of informal settlements from VHR images using Convolutional Neural Networks. Remote Sens. 2017, 9, 1106. [Google Scholar] [CrossRef] [Green Version]
  54. Ansari, R.A.; Buddhiraju, K.M. Textural segmentation of remotely sensed images using multiresolution analysis for slum area identification. Eur. J. Remote Sens. 2019, 52, 74–88. [Google Scholar] [CrossRef] [Green Version]
  55. Fallatah, A.; Jones, S.; Mitchell, D. Object-based random forest classification for informal settlements identification in the Middle East: Jeddah a case study. Int. J. Remote Sens. 2020, 41, 4421–4445. [Google Scholar] [CrossRef]
  56. Wurm, M.; Stark, T.; Zhu, X.X.; Weigand, M.; Taubenböck, H. Semantic segmentation of slums in satellite images using transfer learning on fully convolutional neural networks. ISPRS J. Photogramm. Remote Sens. 2019, 150, 59–69. [Google Scholar] [CrossRef]
  57. Prabhu, R.; Alagu Raja, R.A. Urban Slum Detection Approaches from High-Resolution Satellite Data Using Statistical and Spectral Based Approaches. J. Ind. Soc. Remote Sens. 2018, 46, 2033–2044. [Google Scholar] [CrossRef]
  58. Schmitt, A.; Sieg, T.; Wurm, M.; Taubenböck, H. Investigation on the separability of slums by multi-aspect TerraSAR-X dual-co-polarized high resolution spotlight images based on the multi-scale evaluation of local distributions. Int. J. Appl. Earth Obs. Geoinf. 2018, 64, 181–198. [Google Scholar] [CrossRef] [Green Version]
  59. Li, Y.; Huang, X.; Liu, H. Unsupervised Deep Feature Learning for Urban Village Detection from High-Resolution Remote Sensing Images. Photogramm. Eng. Remote Sens. 2017, 83, 567–579. [Google Scholar] [CrossRef]
  60. Wang, J.; Kuffer, M.; Pfeffer, K. The role of spatial heterogeneity in detecting urban slums. Comput. Environ. Urban Syst. 2019, 73, 95–107. [Google Scholar] [CrossRef]
  61. Ajami, A.; Kuffer, M.; Persello, C.; Pfeffer, K. Identifying a Slums’ Degree of Deprivation from VHR Images Using Convolutional Neural Networks. Remote Sens. 2019, 11, 1282. [Google Scholar] [CrossRef] [Green Version]
  62. Dahiya, S.; Garg, P.K.; Jat, M.K. Automated Extraction of Slum Built-up Areas from Multispectral Imageries. J. Ind. Soc. Remote Sens. 2019, 48, 113–119. [Google Scholar] [CrossRef]
  63. Taubenböck, H.; Kraff, N.J.; Wurm, M. The morphology of the arrival city—A global categorization based on literature surveys and remotely sensed data. Appl. Geogr. 2018, 92, 150–167. [Google Scholar] [CrossRef]
  64. Ranguelova, E.; Weel, B.; Roy, D.; Kuffer, M.; Pfeffer, K.; Lees, M. Image based classification of slums, built-up and non-built-up areas in Kalyan and Bangalore, India. Eur. J. Remote Sens. 2018, 52 (Suppl. 1), 40–61. [Google Scholar] [CrossRef] [Green Version]
  65. Badmos, O.S.; Rienow, A.; Callo-Concha, D.; Greve, K.; Jürgens, C. Urban development in West Africa—Monitoring and intensity analysis of slum growth in Lagos: Linking pattern and process. Remote Sens. 2018, 10, 1044. [Google Scholar] [CrossRef] [Green Version]
  66. Kuffer, M.; Wang, J.; Nagenborg, M.; Pfeffer, K.; Kohli, D.; Sliuzas, R.; Persello, C. The Scope of Earth-Observation to Improve the Consistency of the SDG Slum Indicator. ISPRS Int. J. Geoinf. 2018, 7, 428. [Google Scholar] [CrossRef] [Green Version]
  67. Blaschke, T.; Hay, G.J.; Kelly, M.; Lang, S.; Hofmann, P.; Addink, E.; Queiroz Feitosa, R.; van der Meer, F.; van der Werff, H.; van Coillie, F.; et al. Geographic object-based image analysis—Towards a new paradigm. ISPRS J. Photogramm. Remote Sens. 2014, 87, 180–191. [Google Scholar] [CrossRef] [Green Version]
  68. Pratomo, J.; Kuffer, M.; Kohli, D.; Martinez, J. Application of the trajectory error matrix for assessing the temporal transferability of OBIA for slum detection. Eur. J. Remote Sens. 2018, 51, 838–849. [Google Scholar] [CrossRef] [Green Version]
  69. Kuffer, M.; Pfeffer, K.; Sliuzas, R.; Baud, I. Extraction of slum areas from VHR imagery using GLCM variance. IEEE J. Sel. Top. Appl. Earth Obs. Remote Sens. 2016, 9, 1830–1840. [Google Scholar] [CrossRef]
  70. Wang, J.; Kuffer, M.; Roy, D.; Pfeffer, K. Deprivation pockets through the lens of convolutional neural networks. Remote Sens. Environ. 2019, 234, 111448. [Google Scholar] [CrossRef]
  71. Thomson, D.; Kuffer, M.; Boo, G.; Hati, B.; Grippa, T.; Elsey, H.; Linard, C.; Mahabir, R.; Kyobutungi, C.; Mulandi, J.; et al. Critical Commentary: Need for an Integrated Deprived Area “Slum” Mapping System (IDeAMapS) in LMICs; In Preprints; MDPI: Basel, Switzerland, 2019. [Google Scholar]
  72. Mahabir, R.; Agouris, P.; Stefanidis, A.; Croitoru, A.; Crooks, A.T. Detecting and mapping slums using open data: A case study in Kenya. Int. J. Digit. Earth 2018, 1–25. [Google Scholar] [CrossRef]
  73. Ma, L.; Li, M.; Ma, X.; Cheng, L.; Du, P.; Liu, Y. A review of supervised object-based land-cover image classification. ISPRS J. Photogramm. Remote Sens. 2017, 130, 277–293. [Google Scholar] [CrossRef]
  74. Thomson, D.R.; Linard, C.; Vanhuysse, S.; Steele, J.E.; Shimoni, M.; Siri, J.; Caiaffa, W.T.; Rosenberg, M.; Wolff, E.; Grippa, T.; et al. Extending Data for Urban Health Decision-Making: A Menu of New and Potential Neighborhood-Level Health Determinants Datasets in LMICs. J. Urban Health 2019, 96, 514–536. [Google Scholar] [CrossRef] [PubMed] [Green Version]
  75. Liu, R.; Kuffer, M.; Persello, C. The Temporal Dynamics of Slums Employing a CNN-Based Change Detection Approach. Remote Sens. 2019, 11, 2844. [Google Scholar] [CrossRef] [Green Version]
  76. Sliuzas, R.; Kuffer, M.; Masser, I. The Spatial and Temporal Nature of Urban Objects. In Remote Sensing of Urban and Suburban Areas; Rashed, T., Jürgens, C., Eds.; Springer: Dordrecht, The Netherlands, 2010; Volume 10, pp. 67–84. [Google Scholar]
  77. Corburn, J.; Cohen, A.K. Why We Need Urban Health Equity Indicators: Integrating Science, Policy, and Community. PLoS Med. 2012, 9, e1001285. [Google Scholar] [CrossRef]
  78. Lilford, R.J.; Oyebode, O.; Satterthwaite, D.; Melendez-Torres, G.J.; Chen, Y.-F.; Mberu, B.; Watson, S.I.; Sartori, J.; Ndugwa, R.; Caiaffa, W.; et al. Improving the health and welfare of people who live in slums. Lancet 2017, 389, 559–570. [Google Scholar] [CrossRef]
  79. Christ, K.; Baier, K.; Azzam, R. Slums and informal housing in India: A critical look at official statistics with regard to water and sanitation. Water Int. 2016, 41, 308–324. [Google Scholar] [CrossRef]
  80. Friesen, J.; Taubenböck, H.; Wurm, M.; Pelz, P.F. The similar size of slums. Habitat Int. 2018, 73, 79–88. [Google Scholar] [CrossRef]
  81. Openshaw, S. The Modifiable Areal Unit Problem; Geo Books: Norwich, UK, 1984. [Google Scholar]
  82. UN-Habitat. The Challenge of Slums: Global Report on Human Settlements 2003; Earthscan Publications Ltd.: London, UK; Sterling, VA, USA, 2003. [Google Scholar]
  83. Wardrop, N.A.; Jochem, W.C.; Bird, T.J.; Chamberlain, H.R.; Clarke, D.; Kerr, D.; Bengtsson, L.; Juran, S.; Seaman, V.; Tatem, A.J. Spatially disaggregated population estimates in the absence of national population and housing census data. Proc. Natl. Acad. Sci. USA 2018, 115, 3529. [Google Scholar] [CrossRef] [Green Version]
  84. Baud, I.; Pfeffer, K.; Sridharan, N.; Nainan, N. Matching deprivation mapping to urban governance in three Indian mega-cities. Habitat Int. 2009, 33, 365–377. [Google Scholar] [CrossRef]
  85. Aditya, T.; Sugianto, A.; Sanjaya, A.; Susilo, A.; Zawani, H.; Widyawati, Y.S.; Amin, S. Channelling participation into useful representation: Combining digital survey app and collaborative mapping for national slum-upgrading programme. Appl. Geomat. 2019, 1–16. [Google Scholar] [CrossRef]
  86. Pratomo, J.; Kuffer, M.; Martinez, J.; Kohli, D. Coupling uncertainties with accuracy assessment in object-based slum detections, case study: Jakarta, Indonesia. Remote Sens. 2017, 9, 1164. [Google Scholar] [CrossRef] [Green Version]
  87. Kohli, D.; Stein, A.; Sliuzas, R. Uncertainty analysis for image interpretations of urban slums. Comput. Environ. Urban Syst. 2016, 60, 37–49. [Google Scholar] [CrossRef]
  88. Wurm, M.; Taubenböck, H. Detecting social groups from space—Assessment of remote sensing-based mapped morphological slums using income data. Remote Sens. Lett. 2018, 9, 41–50. [Google Scholar] [CrossRef]
  89. de Albuquerque, J.P.; Yeboah, G.; Pitidis, V.; Ulbrich, P. In Towards a participatory methodology for community data generation to analyse urban health inequalities: A multi-country case study. In Proceedings of the 52nd Hawaii International Conference on System Sciences, Maui, HI, USA, 8–11 January 2019; pp. 3926–3935. [Google Scholar]
  90. Githira, D.N. Growth and Eviction of Informal Settlements in Nairobi; University of Twente Faculty of Geo-Information and Earth Observation (ITC): Enschede, The Netherlands, 2016. [Google Scholar]
  91. Kuffer, M.; Pfeffer, K.; Sliuzas, R.; Baud, I.; van Maarseveen, M. Capturing the Diversity of Deprived Areas with Image-Based Features: The Case of Mumbai. Remote Sens. 2017, 9, 384. [Google Scholar] [CrossRef] [Green Version]
  92. Gevaert, C.M.; Persello, C.; Elberink, S.O.; Vosselman, G.; Sliuzas, R. Context-Based Filtering of Noisy Labels for Automatic Basemap Updating From UAV Data. IEEE J. Sel. Top. Appl. Earth Obs. Remote Sens. 2018, 11, 2731–2741. [Google Scholar] [CrossRef]
  93. Leyk, S.; Gaughan, A.E.; Adamo, S.B.; de Sherbinin, A.; Balk, D.; Freire, S.; Rose, A.; Stevens, F.R.; Blankespoor, B.; Frye, C.; et al. The spatial allocation of population: A review of large-scale gridded population data products and their fitness for use. Earth Syst. Sci. Data 2019, 11, 1385–1409. [Google Scholar] [CrossRef] [Green Version]
  94. World Bank. Productive and Inclusive Cities for an Emerging Congo (English). In Democratic Republic of Congo Urbanization Review: Directions in Development; Environment and Sustainable Development; World Bank Publications: Washington, DC, USA, 2017. [Google Scholar]
  95. Jochem, W.C.; Bird, T.J.; Tatem, A.J. Identifying residential neighbourhood types from settlement points in a machine learning approach. Comput. Environ. Urban Syst. 2018, 69, 104–113. [Google Scholar] [CrossRef]
  96. OpenStreetMap contributors. Residential Network and Building Footprints Data for the Democratic Republic of Congo; the OpenStreetMap Foundation (OSMF): Cambridge, UK, 2018. [Google Scholar]
  97. Thomson, D.R.; Stevens, F.R.; Ruktanonchai, N.W.; Tatem, A.J.; Castro, M.C. GridSample: An R package to generate household survey primary sampling units (PSUs) from gridded population data. Int. J. Health Geogr. 2017, 16, 25. [Google Scholar] [CrossRef] [PubMed] [Green Version]
  98. Brown, T.A. Confirmatory Factor Analysis for Applied Research; Guilford: New York, NY, USA; London, UK, 2006. [Google Scholar]
  99. Grippa, T.; Lennert, M.; Beaumont, B.; Vanhuysse, S.; Stephenne, N.; Wolff, E. An Open-Source Semi-Automated Processing Chain for Urban Object-Based Classification. Remote Sens. 2017, 9, 358. [Google Scholar] [CrossRef] [Green Version]
  100. Drăguţ, L.; Csillik, O.; Eisank, C.; Tiede, D. Automated parameterisation for multi-scale image segmentation on multiple layers. ISPRS J. Photogramm. Remote Sens. 2014, 88, 119–127. [Google Scholar] [CrossRef] [PubMed] [Green Version]
  101. Georganos, S.; Grippa, T.; Lennert, M.; Johnson, B.A.; Vanhuysse, S.; Wolff, E. SPUSPO: Spatially Partitioned Unsupervised Segmentation Parameter Optimization for Efficiently Segmenting Large Heterogeneous Areas. In Proceedings of the 2017 Conference on Big Data from Space (BiDS’17), Toulouse, France, 28–30 November 2018; pp. 28–30. [Google Scholar]
  102. Georganos, S.; Grippa, T.; Lennert, M.; Vanhuysse, S.; Johnson, B.A.; Wolff, E. Scale Matters: Spatially Partitioned Unsupervised Segmentation Parameter Optimization for Large and Heterogeneous Satellite Images. Remote Sens. 2018, 10, 1440. [Google Scholar] [CrossRef] [Green Version]
  103. Grippa, T.; Georganos, S.; Zarougui, S.; Bognounou, P.; Diboulo, E.; Forget, Y.; Lennert, M.; Vanhuysse, S.; Mboga, N.; Wolff, E. Mapping Urban Land Use at Street Block Level Using OpenStreetMap, Remote Sensing Data, and Spatial Metrics. ISPRS Int. J. Geo Inf. 2018, 7, 246. [Google Scholar] [CrossRef] [Green Version]
  104. Graesser, J.; Cheriyadat, A.; Vatsavai, R.R.; Chandola, V.; Long, J.; Bright, E. Image based characterization of formal and informal neighborhoods in an urban landscape. IEEE J. Sel. Topics Appl. Earth Obs. Remote Sens. 2012, 5, 1164–1176. [Google Scholar] [CrossRef]
  105. Engstrom, R.; Sandborn, A.; Yu, Q.; Burgdorfer, J.; Stow, D.A.; Weeks, J.; Graesser, J. Mapping Slums Using Spatial Features in Accra, Ghana. In Proceedings of the Joint Urban Remote Sensing Event (JURSE), Lausanne, Switzerland, 30 March–1 April 2015; pp. 1–4. [Google Scholar]
  106. Engstrom, R.; Pavelesku, D.; Tanaka, T.; Wambile, A. In Mapping Poverty and Slums Using Multiple Methodologies in Accra, Ghana. In Proceedings of the 2019 Joint Urban Remote Sensing Event (JURSE), Vannes, France, 22–24 May 2019; pp. 1–4. [Google Scholar]
  107. Engstrom, R.; Newhouse, D.; Haldavanekar, V.; Copenhaver, A.; Hersh, J. In Evaluating the Relationship between Spatial and Spectral Features Derived from High Spatial Resolution Satellite Data and Urban Poverty in Colombo, Sri Lanka. In Proceedings of the 2017 Joint Urban Remote Sensing Event (JURSE), Dubai, UAE, 6–8 March 2017; pp. 1–4. [Google Scholar]
  108. Engstrom, R.; Hersh, J.S.; Newhouse, D.L. Poverty from Space: Using High-Resolution Satellite Imagery for Estimating Economic Well-Being; Strategic Research Program (SRP): Washington, DC, USA, 2017. [Google Scholar]
  109. Engstrom, R.; Harrison, R.; Mann, M.; Fletcher, A. In Evaluating the Relationship Between Contextual Features Derived from Very High Spatial Resolution Imagery and Urban Attributes: A Case Study in Sri Lanka. In Proceedings of the 2019 Joint Urban Remote Sensing Event (JURSE), Vannes, France, 22–24 May 2019; pp. 1–4. [Google Scholar]
  110. Karnataka Slum Development Board. Slum Details. Available online: http://ksdb.kar.nic.in/slums.asp (accessed on 10 January 2018).
  111. Roy, D.; Lees, M.H.; Pfeffer, K.; Sloot, P.M.A. Spatial segregation, inequality, and opportunity bias in the slums of Bengaluru. Cities 2018, 74, 269–276. [Google Scholar] [CrossRef]
  112. Szegedy, C.; Wei, L.; Yangqing, J.; Sermanet, P.; Reed, S.; Anguelov, D.; Erhan, D.; Vanhoucke, V.; Rabinovich, A. In Going Deeper with Convolutions. In Proceedings of the 2015 IEEE Conference on Computer Vision and Pattern Recognition (CVPR), Boston, MA, USA, 7–12 June 2015; pp. 1–9. [Google Scholar]
  113. Farabet, C.; Couprie, C.; Najman, L.; LeCun, Y. Learning Hierarchical Features for Scene Labeling. IEEE Trans. Pattern Anal. Mach. Intell. 2013, 35, 1915–1929. [Google Scholar] [CrossRef] [Green Version]
  114. Persello, C.; Stein, A. Deep Fully Convolutional Networks for the Detection of Informal Settlements in VHR Images. IEEE Geosci. Remote Sens. Lett. 2017, 14, 2325–2329. [Google Scholar] [CrossRef]
  115. Zhang, L.; Zhang, L.; Du, B. Deep Learning for Remote Sensing Data: A Technical Tutorial on the State of the Art. IEEE Geosci. Remote Sens. Mag. 2016, 4, 22–40. [Google Scholar] [CrossRef]
  116. Maggiori, E.; Tarabalka, Y.; Charpiat, G.; Alliez, P. Convolutional Neural Networks for Large-Scale Remote-Sensing Image Classification. IEEE Trans. Geosci. Remote Sens. 2017, 55, 645–657. [Google Scholar] [CrossRef] [Green Version]
  117. Fu, G.; Liu, C.; Zhou, R.; Sun, T.; Zhang, Q. Classification for High Resolution Remote Sensing Imagery Using a Fully Convolutional Network. Remote Sens. 2017, 9, 498. [Google Scholar] [CrossRef] [Green Version]
  118. Bergado, J.R.; Persello, C.; Stein, A. Recurrent Multiresolution Convolutional Networks for VHR Image Classification. IEEE Trans. Geosci. Remote Sens. 2018, 56, 6361–6374. [Google Scholar] [CrossRef] [Green Version]
  119. Wang, J.; Kuffer, M.; Sliuzas, R.; Kohli, D. The exposure of slums to high temperature: Morphology-based local scale thermal patterns. Sci. Total Environ. 2019, 650, 1805–1817. [Google Scholar] [CrossRef] [PubMed]
  120. Stevens, F.R.; Gaughan, A.E.; Linard, C.; Tatem, A.J. Disaggregating Census Data for Population Mapping Using Random Forests with Remotely-Sensed and Ancillary Data. PLoS ONE 2015, 10, e0107042. [Google Scholar] [CrossRef] [Green Version]
  121. Kit, O.; Lüdeke, M.; Reckien, D. Defining the bull’s eye: Satellite imagery-assisted slum population assessment in Hyderabad, India. Urban Geogr. 2013, 34, 413–424. [Google Scholar] [CrossRef]
  122. Kotadiya, R.; Kuffer, M.; Sliuzas, R.V.; Patel, S. Post-Resettlement Socio-Economic Dynamics. In The Case of Ahmedabad, India; van Maarseveen, M.F.A.M., Martinez, J.A., Flacke, J., Eds.; CRC Press: Boca Raton, FL, USA, 2018; pp. 245–266. [Google Scholar]
  123. Patel, S.; Sliuzas, R.; Mathur, N. The risk of impoverishment in urban development-induced displacement and resettlement in Ahmedabad. Environ. Urban 2015, 27, 231–256. [Google Scholar] [CrossRef] [Green Version]
Figure 1. Deprived area maps of Nairobi, Kenya generated with four different approaches to deprived area mapping—(A) Aggregated deprived households (data source: Improving Health in Slums Collaborative [89]),(B) field-based mapping (data source: Slum Dwellers International (SDI)), (C) human imagery classification (data source: Faculty of Geo-Information Science and Earth Observation (ITC) [90]), and (D) machine-learning imagery classification using Sentinel-2 imagery (2019).
Remotesensing 12 00982 g001
Figure 2. Omission and commission errors comparing human and machine-learning deprived area maps in Mumbai (left), and an example of a small deprived area mapped by the machine-learning-based approach (right) (Source Image: WorldView-2, DigitalGlobe).
Remotesensing 12 00982 g002
Figure 3. Outline of an integrated deprived area mapping “system” (adapted from [71]). SDGs: sustainable development goals.
Remotesensing 12 00982 g003
Figure 4. The methods used in key peer-reviewed articles on Earth observation-based deprived area mapping since 2016. ML: machine-learning, CNN: convolutional neural networks, and OBIA: object-based image analysis.
Remotesensing 12 00982 g004
Figure 5. Ahmedabad, India: part of the historic city center (a) and deprived area (b) (source: Google Earth).
Remotesensing 12 00982 g005
Figure 6. Kinshasa, Democratic Republic of the Congo; Municipal map (a) and deprivation index (b).
Remotesensing 12 00982 g006
Figure 7. Land use map showing Dar es Salaam, Tanzania (left) input very high-resolution (VHR) image (upper right) and detailed city block classification (lower right).
Remotesensing 12 00982 g007
Figure 8. Mumbai deprived areas mapped at an aggregation level of 100 m (left) on top of a Planetscope image; Bangalore with the same 100-m grid (right) on top of Pleiades images and ground photo of a temporary settlement in Bangalore (lower right).
Remotesensing 12 00982 g008
Figure 9. Comparison of cases (Section 3.2) on their roles for addressing scalability and transferability.
Remotesensing 12 00982 g009
Table 1. Requirements for integrated deprived area maps (summarized partially from [8,74]).
RequirementDescription
Relating to area physical characteristicsDeprivation is defined by the neighborhood physical characteristics using the three levels of slum ontology [7]:
Object, e.g.,
-
building characteristics (size, shape, and height)
-
road and other access networks
Settlement, e.g.,
-
building density
-
settlement shape
Environ, e.g.,
-
proximity to public green or blue spaces
-
steep slopes and flood zones or
-
proximity to railways and high-voltage power lines
Relating to area social characteristicsDeprivation is defined by the neighborhood social environment
Social capital, e.g.,
-
social capital supported by community-based organizations and among neighbors with shared identities
Stigmatization, e.g.,
-
presence of crime
(Social) facilities, e.g.,
-
proximity and accessibility to schools, health facilities, shops, jobs, and public infrastructure
Context-dependentDeprivation is related to the local context
Local context
-
Neighborhoods that are classified as deprived are consistent with local definitions and understandings of deprivation
Fit to capture temporal dynamics
-
Neighborhood deprivation classification can change over time to reflect the dynamics of cities as they evolve
Comparable across cities and countriesGlobal coverage
-
Definitions of neighborhood deprivation across cities and countries such that data collected about those neighborhoods can be combined and compared
Updated frequently with timely dataFrequent updates
-
Neighborhood-deprived area maps are produced on a routine basis to be useful for planning and monitoring
Protective of individual privacy and vulnerable populationsDeprived area maps are sufficiently detailed to support planning and monitoring but do not reveal exact locations of slums, informal settlements, and areas of inadequate housing
-
Privacy and geo-ethics need to prevent malicious use of the data for neighborhood displacement, fines, and harassment
Developed via an inclusive multi-stakeholder processDeprived area maps should be customized to stakeholders, e.g.,
-
a self-identified slum community advocating for recognition
-
a city government planning new infrastructure
-
a national government allocating funds to programs
Table 2. Strengths of the existing approaches to deprived area mapping.
ApproachStrengths
Aggregated slum householdThe measure of household-level poverty
-
Commonly available across cities and countries (e.g., census and health surveys)
-
Detailed information on different deprivation domains (e.g., socioeconomic)
Field-based mappingRelating to both neighborhood-level social and physical characteristics
-
Provides a neighborhood deprivation definition(s) in the local context
-
Empowerment of residents
Human imagery interpretationRelating to neighborhood physical characteristics
-
Using visual interpretation elements specific to deprived areas
-
Delineation of crisp boundaries based on RGB images (e.g., Google Earth)
Machine imagery classificationRelating to neighborhood physical characteristics
-
Computational efficiency and scalable
-
Potential to be comparable across cities and countries
-
Can be updated frequently with timely data

